When I posted last week about monetary economist Bill Poole’s incorrect claim that the Fed Reserve sets the Federal Funds rate, a number of commenters objected that my claim was trivial. Most argued that Poole’s usage was close enough to being correct because the Fed can so accurately hit its target.
My good friend and monetary economist Jeff Hummel has sent me the graph below. He writes:
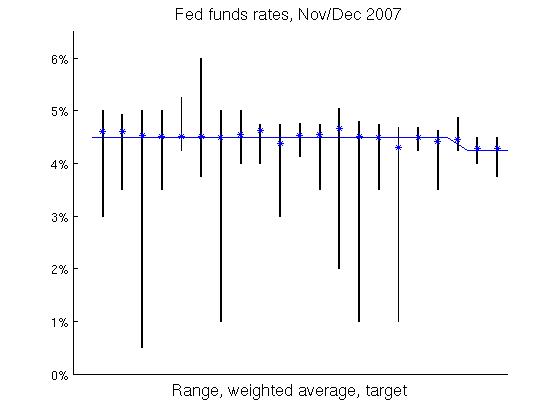
The solid blue line is the Fed funds target for the period covered; the asterisks are the effective Fed funds rate for each day; but that is only a weighted average of all Fed funds transactions for the day, the dispersion of which is shown by the vertical black lines. And this is when the Fed is doing a good job of hitting its target.
Update: William Luther comments.
READER COMMENTS
Khodge
Nov 29 2015 at 5:24pm
Thanks for these posts…I kept reading about how the Fed was setting rates but I could not figure out what that magic tool was. Admittedly, it can set such things as the overnight rate but that is trivial relative to the claims being made.
Scott Sumner
Nov 29 2015 at 7:15pm
I would defend your post. I think it’s useful to occasionally point out that the Fed doesn’t set the fed funds rate, but rather indirectly influences it by adjusting the quantity of base money.
I do understand why some of your commenters might object, and here’s what I’d say in response. If I was chatting informally with a monetary policy expert, and they referred to the Fed setting the fed funds rate, I would not correct them, on the assumption they knew how it was done, and were speaking loosely. But in a blog for general readers it’s worth reminding people every once and a while that the Fed can only affect rates by changing some other variable, like the quantity of base money (or demand for base money). Otherwise people get confused, as when the fed funds rate fell from 5 1/4% in August 2007 to 2% in May 2008. Many people wrongly assumed that the Fed did something concrete to make this happen. In fact, rates simply fell in the free market, and the Fed did not inject any new money into the economy during this 9 month period. The Fed’s adjustment in its fed funds target did not cause rates to fall, they were just validating what the markets had already done. It would have taken an affirmative action (reducing the money supply) to prevent rates from falling.)
Daniel Kuehn
Nov 29 2015 at 7:33pm
I think it was trivial or worthwhile depending on the audience for the reasons that Scott states. I am curious exactly what “dispersion” these vertical lines are. All transactions? An interquartile range? Some other kind of bound or CI? It makes a big difference and I don’t really know what I’m looking at.
Jeffrey Rogers Hummel
Nov 29 2015 at 10:08pm
To answer Daniel’s question, the dispersion covers all transactions in a single day. The NY Fed website is where recent data is available, and if you scroll down you can find an interactive graph that will take you back as far as 2000. This was the site used for the graph that David posted, which was actually passed on to me by my colleague Warren Gibson, although since the time he copied it, the New York Fed has modified the display slightly.
Patrick R. Sullivan
Nov 30 2015 at 10:15am
As you know, Scott, back in the early 1980s Paul Volcker corrected James Tobin about this very point. Don’t assume too much.
Jim Dow
Nov 30 2015 at 10:54am
Why Nov/Dec 2007 of all times as the sample period? I remember a fair amount of economic uncertainty around then.
The bars seem to be marking highs/lows. The way the Fed funds market works, at least when I was following closely, was that it was relatively stable during the day but that you could see wide swings late in the day when the market was near closing. Basically the Fed would set reserves based on expected daily demand, but then there would be various demand shocks during the day and this could leave a bank with excess reserves (and willing to lend overnight at a rate near 0) or short of reserves (and willing to pay a high rate for a small amount of reserves to avoid going to the discount window).
The question is whether those kind of fluctuations are economically meaningful. In other words, are most of the transactions at the expected rates or are most at the very high or very low rates? The answer to that is the rate weighted by transaction size – the effective funds rate – and that looks pretty good in the picture.
Jeffrey Rogers Hummel
Nov 30 2015 at 11:05am
Since this topic has come up again, let me share a few thoughts about comments made to David’s original post. William Luther is quite correct about why this interest rate is referred to as the Federal funds rate. Not only are bank deposits at the Fed what is lent and borrowed, but the Fed is the clearinghouse for these transactions. However, targeting this rate has only been the “traditional” Fed policy tool going back to the mid-1980s. Prior to that, the Fed went through assorted other primary targets.
Michael Byrnes is absolutely right about the significant difference between “targeting” and “setting,” for reasons he clearly states in his comment of Nov. 26. And I can positively attest that thinking that the Fed “sets” interest rates causes enormous confusion among the general public, as I am reminded every time I teach my Money and Banking class. To generalize, the distinction between a government price control and a government price support is far from economically trivial.
Moreover, many of the commenters have overestimated the ease with which the Fed does actually hit this target, which is why I passed along Warren’s graph. Stating that the “Fed” sets the rate leaves the uninformed with the false impression that the Fed determines interest rates overall. As Scott Sumner points out in his comment above and I argued in a Liberty Fund article, the Fed is almost always following the market, rather than the other way around. Even Ben Bernanke admitted, after leaving the Fed, in the first post he made at his blog: “The Fed’s ability to affect real rates of return, especially longer-term real rates, is transitory and limited. Except in the short run, real interest rates are determined by a wide range of economic factors, including prospects for economic growth—not by the Fed.”
The Fed’s ability to hit its Federal funds target has become so attenuated since the financial crisis, that it has fudged by replacing a target rate with a target range of 25 basis points. Initially the interest rate on reserves (0.25 percent) was supposed to put a lower bound on the Federal funds rate, which of course never happened. Indeed, quite the opposite, with the Fed funds rate consistently below the interest rate on reserves. Because of the subsequent accumulation of reserves by banks, not only did Federal funds lending collapse from over $200 billion to nearly a third of that, but government-sponsored enterprises, notably the Federal Home Loan Banks, became the dominant lenders in this market.
Daniel Kuehn
Nov 30 2015 at 12:02pm
Jeff –
So if it’s all transactions the distribution might be much, much tighter around the target than these vertical lines suggest. Judging by the very tight distribution above the average it seems very likely that these distributions are indeed tighter than your graph suggests and that there’s a long left tail.
William Luther
Nov 30 2015 at 3:20pm
If you don’t think the educated public is confused about the relationship between Fed policy and interest rates, take a look at the graphic here and get back to me…
http://www.thenation.com/article/the-federal-reserve-could-boost-employment-and-investment-heres-how/
Comments are closed.