Categories:
Politics and Economics
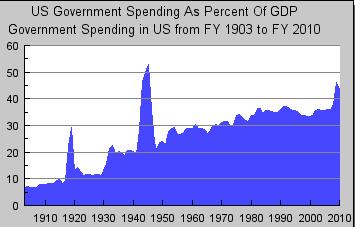
Arnold’s last post inspired me to double-check the long-term trend of government spending relative to GDP. Here’s a nice graph courtesy of www.usgovernmentspending.com:
Aside from the two World Wars, the growth was almost linear until the early Reagan years. Then it was basically flat until the late Bush years, when it exploded. Now we’re almost exactly where we would have been if you did a linear extrapolation for the Truman-to-Carter era (or the Teddy Roosevelt-to-Carter era for that matter).
I hope this means the recent explosion is just a blip. But I’ve got to admit it’s possible that the Reagan-Bush II was the blip. What do you think?
READER COMMENTS
Arthur_500
Jan 30 2010 at 12:40am
The graph reminds me of juvenile Business Plans done with a spreadsheet program. The growth rate just keeps expanding at the same rate.
I can understand a growth in the value of the Dow. However continued growth, such as this, of Government as a percentage of GDP, is a dangerous road.
No public employee can ever pay enough taxes to cover their own cost. Therefore, the greater the government burden the more the cost falls on the shoulders of the Private Sector.
When Government takes too much out of an economy the economy will topple. There is no reason why the US economy won’t crumble under the over-burden of an oppressive government just as others have done before.
Bob Murphy
Jan 30 2010 at 12:43am
Actually doesn’t it look like the real blip was Bill Clinton–and a blip *down*?
And I know people will credit the Republicans, but then why didn’t spending really collapse under Bush II?
So to answer Bryan’s question, assuming huge Republican victories in November, I would predict a blip downward.
But I’m not a slave to historical trends; I think the % will grow because (a) government spending will keep growing and (b) the real economy will grow sluggishly at best.
Norman
Jan 30 2010 at 1:10am
I think Bob Murphy seems closer to the truth. Just from eyeballing the graph, it looks like there was a shift in the intercept around 1930 such that the % grew at about the same pace as before, but at a higher level than under the original trend. It looks like there was a comparable (but more gradual) jump down in the Clinton years. It remains to be seen, then, which trend we return to after the most recent spike.
Of course, none of this is based on formal statistical analysis, and I’d say we should only trust our ability to eyeball a graph so much.
Doc Merlin
Jan 30 2010 at 1:27am
What I think:
DOOOM! DOOOOOM!
No, in more seriousness, if we model the government as a revenue and power maximizing agent. Then, as technology increases they can afford to raise the tax to gdp ratio and the regulatory level without completely trashing their revenue.
Another way of putting it is, that technology shifts the laffer curve rightward.
James
Jan 30 2010 at 2:25am
Arthur_5000,
What’s the deal with:
“No public employee can ever pay enough taxes to cover their own cost. Therefore, the greater the government burden the more the cost falls on the shoulders of the Private Sector.”
Are you seriously trying to imply that the public sector exists simply in order to serve itself? … Keep trying, dude.
RL
Jan 30 2010 at 3:29am
I think the key point shown by the graph–a really frightening and amazing point when you reflect on it–is that the spending over the last few years represents nothing more than the spending during WWI and WWII…in a time of relative piece (no one would confuse Iraq and Afghanistan with world wars), we are spending as if we are in world wars…
Ed Hanson
Jan 30 2010 at 8:10am
It has become natural to correlate fiscal trends with presidency. And it is true that very strong presidents, in particular, FDR and Reagan, can change the pattern. However, such strong presidents are rare.
The much closer correlation to the growth curve is the party controlling the legislative branch. In recent years, as example, the down trend in the 90’s came with the republican House (1994), and the uptrend in the 00’s came with the democrat house (2006). I believe this may be true for the resumption of the upward curve in the 50’s and the flat curve of the 20’s.
So the determination of the blip may be by which party has control of the House next election.
Tom West
Jan 30 2010 at 9:11am
Two things:
(1) What can’t continue, won’t.
(2) I think Tyler is right. As a whole, as a society gets wealthier, one of the things it likes to buy more of is government. And it has.
At some point the gov’t can’t borrow more money and gov’t spending will reach what the population considers to be socially optimal.
However, the adjustment between spending with borrowing and spending without borrowing will certainly be very bumpy.
Tom Ault
Jan 30 2010 at 10:55am
I’d just like to point out that some commenters are looking at a graph of total government spending (the sum of federal, state and local spending) and drawing correlations based on which party controls one or two branches of the federal government. A quick look at graphs of federal, state and local spending shows federal spending has hovered around 20% of GDP since the 50s, while state and local expenditures have risen steadily over the same period. I don’t think it is fair to hold either party at the federal level responsible for what the states do — at least not without a more sophisticated analysis of the impact of federal legislation on state expenditures, but certainly not on a naieve correlation drawn from a simple graph.
Michael M
Jan 30 2010 at 10:57am
“Actually doesn’t it look like the real blip was Bill Clinton–and a blip *down*?”
Well, as Ed points out, Congress has more control over the purse than the president. Regardless, the name of the administration is as good a marker as any, in the same way the Romans once marked the year by who was Consul, for demarking certain time periods.
It’d be hard to get exact numbers (you’d have to control for the cycle, do some other statistical things I don’t feel like doing on a Saturday morning), but it does appear that the growth rate dipped downward during the Reagan administration, going negative sometime during the Clinton administration (I’ll bet it’s 1994 or ’95 if you look at the numbers).
Still, if you look at what Reagan (and the 96th, 97th, 98th, and 99th Congresses) actually did, I don’t have much hope for an electoral coalition that can really bring government spending under control. Reagan still pumped money into the military-industrial complex like no tomorrow (and never even talked about reversing that trend), and didn’t make any moves against entitlements older than LBJ.
More worrying yet, the state and local figure is much more diffuse a phenomenon. You don’t turn this one around by winning one or even a few dozen elections. You need to win hundreds.
Dave Budge
Jan 30 2010 at 12:23pm
It would be interesting to look at the contribution to GDP the financial services sector had during the flattening period. Without having the facts in front of me it seems the growth rate of finance as a percentage of GDP may have overstated overall GDP by virtue that the actual risk discount was not reflected in their output numbers. Accordingly, government spending would be understated on the graph – at least in the Clinton – Bush period.
David C
Jan 30 2010 at 4:05pm
The President has a great deal more control over the budget than Congress. The President determines all discretionary spending in his annual budget, and then Congress makes a few minor changes, adds a little pork, and approves it. For non-discretionary spending, Congress makes a few changes every few years but nothing drastic. I don’t know the last time Congress passed a social security law, and health care over the past couple decades has mostly consisted of controlling costs to delay the problem every few years, the 2003 and most recent health care legislation being notable exceptions.
I think an old post by Matthew Yglesias gives a good explanation for part of the reason government continues to increase in size:
http://yglesias.thinkprogress.org/archives/2009/01/the_case_for_ever_bigger_government.php
Loof
Jan 30 2010 at 4:14pm
The Guns’n’Butter Blip: and Uncle Sam flopped!
Ed Hanson
Jan 30 2010 at 5:15pm
“David C writes:
The President has a great deal more control over the budget than Congress. The President determines all discretionary spending in his annual budget, and then Congress makes a few minor changes, adds a little pork, and approves it.”
I can still remember the democrat congress and Tip O’Neill yearly statement, that the Reagan budget was dead on arrival. And then proved they had the power to do that. No reduced budget by the Reagan admin, no promise of 2 dollar budget reduction for every new tax dollar, made any difference. Do not kid yourself that the president has real control of the budget when the other party has control of the legislature. Clinton years proved it also.
Snorri Godhi
Jan 30 2010 at 5:33pm
Tom Ault’s observation, that all of the increase in the graph after Truman is due to state spending, rather than federal spending, makes most of the comments in this thread obsolete, I am afraid.
Still, it is worth asking why state spending increased and federal spending stayed approx. constant, when states face tax competition and the federal government does not (not to the same extent, anyway). The tax competition is real, if what I read about people leaving New York and California is true; but maybe tax competition became a concern only when state taxes became half as much as federal taxes.
(And of course we should keep in mind that a graph of government spending says nothing about the burden of government regulation.)
kebko
Jan 30 2010 at 7:09pm
Snorri,
I don’t know if Tom Ault’s observation is all that cut & dried. From the peak around 1953 to 2000, the total spending figure doesn’t really change that much, and most of the growth since then is federal. I think the reality is probably a little more complicated, and probably depends on where you put your start & finish line.
kebko
Jan 30 2010 at 7:13pm
On another note, seeing this graph, it occurs to me that there is an argument that we didn’t escape the Depression until after WWII because most of the GDP of the time had to do with government spending related to the war.
Considering that government spending is nearing that same level, what does that say about our current measures of production? Wouldn’t we suppose that we would say the same thing about today’s economy? Instead of boats & bombs, we’re funding ethanol plants and drug sniffing machines.
Randy
Jan 30 2010 at 7:58pm
James,
“Are you seriously trying to imply that the public sector exists simply in order to serve itself?”
What evidence do you have to the contrary? The facts are they take money by force and spend it as they see fit. The claim that what they do has value is just that – a claim. To prove that their so-called services have value they would have to submit to a voluntary system of payment, and the fact that they do not so submit is very stong evidence that the so-called services do not have value to those who are currently forced to pay for them.
Strategic75
Jan 30 2010 at 9:04pm
One key element gets overlooked when considering government spending/debt loads. I think of it as a household. In terms of a family’s debt loads, how much is too much? 60% of annual income? 100% of annual income? Before you answer, consider the gross amount of debt tied to your home relative to your annual income. As always, the answer to the question of how much is too much depends. On what? Most prominently it depends on the stage of the family’s economic life cycle. Much as a family, with parents in their 20’s, with two young children, might take on mortgage debt, car loan debt, and even furniture debt, and not necessarily be overburdened (sensible GDS and TDS-please), if our country is in an enfant, or young adult in this case, economic life cycle phase, maybe 100% debt isn’t too much? Do I hate government debt? Yes, I hate almost all debt. I even named my oldest son after the only president to eliminate the national debt, Andrew Jackson. By the way, the manner in which Old Hickory did this is probably instructive…sale of federal lands. I say, line up the global economic forces that be and let’s have a garage sale for the grand canyon, or any other federal land, to get rid of the national debt. The fed would probably have to set rates at 35% if that happened to keep inflation from going nuts.
The point is that although we all know that taking on more debt limits future economic choices, and probably future GDP in our case, the percentage of debt that we’ve taken on could be not as bad as many people are making it out to be. I wouldn’t bet on it but I think it is worth considering.
Arthur_500
Jan 31 2010 at 12:37am
This is neither political nor bashing government employees. All I said is that a public employee gets paid out of the government coffers.
Private sector individuals pay into that pot of money just as do government employees. However, private sector employees do not receive their pay from the government so 100% of taxes from private sector employees is available for paying for the cost of government.
Since public sector employees get paid by the government the taxes they pay immediatley go toward paying for the cost of that employee. Since they can’t pay 130% of their wages in taxes they can never cover their own cost.
In short, as government continues to be a larger piece of GDP the amount of money available to keep it running diminishes. A Public Sector Employee earning $35,000 peer year cost the government roughly %50,000. They might pay $10,000 in taxes so the government still needs $40,000 in tax revenue just to cover that one employee’s wages. Let’s say I pay $10,000 per year in FITW. That means you need three more of me just to cover the wages for one government employee.
If it takes four Private sector employees to cover the wages of one government employee then one could extrapolate that government size greater than 20% of GDP could topple the society.
You can show me that our government in relation to GDP has been in excess than that figure for quite a while. However, real earnings have been decreasing since the 1970’s when government size exceeded 30%.
You would need greater study to determine if this is coincidence or truly a viable statistic. However, I argue that common sense would dictate we have probably already crossed a threshhold at which government begins to hinder economic success. As economic success is hindered then there is ever smaller tax revenues to support an oversized government.
Snorri Godhi
Jan 31 2010 at 2:27am
Kebko: when I wrote “after Truman”, what I really meant was “after Truman and before 2007”. Sorry about that.
Comments are closed.