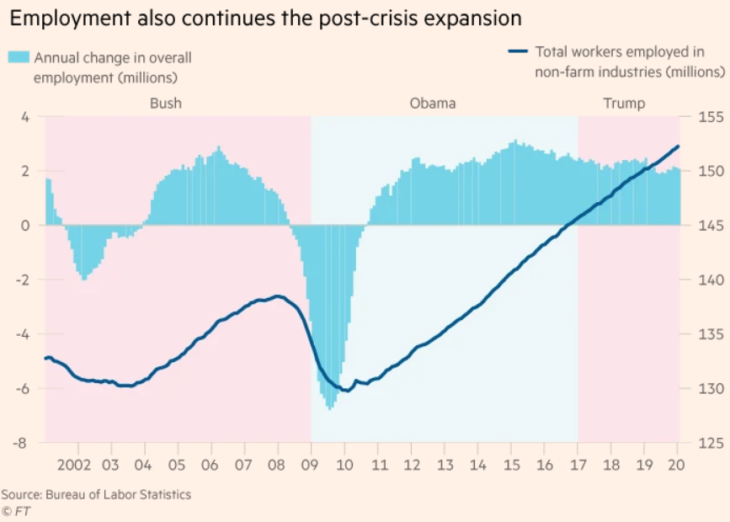
Here’s a nice graph from the Financial Times:
These graphs are very manipulative, as we think we are seeing the impact of various presidents on the economy. But is that really so? I’ve argued that the performance of the US (economic, military, social, etc.) is about 3% the president and 97% other factors. Three percent is not nothing; it’s way more influence than a blogger has. But it’s not enough to be decisive.
This tendency to think in terms of a “Bush economy”, or an “Obama economy” is especially pronounced in election years. But which indicator is decisive? Should we look at the graph and conclude that Trump inherited an economy that was already improving, or should we acknowledge that it gets harder to create jobs once we reach a low unemployment rate, and hence Trump outperformed expectations? There’s a bit of truth in both views.
I don’t believe that, deep down, people actually believe the economy is a test of a president’s performance. They may make that claim when it’s convenient, but I don’t think they really believe it. Here’s why:
1. Ask a Democrat about the current economy and they’ll often say that Trump just got lucky; the low unemployment is not related to anything he did. He inherited an improving economy from President Obama. Republicans will argue just the opposite. So does that mean that Republicans believe that the economy is determined by the President, and the Democrats take my view? Not really.
2. During most of the past 100 years the situation was reversed. On average, the economy (and stock market) did better under Democratic presidents. So if the president actually did determine the course of the economy, then this would be evidence that “proved” Democratic economic policies were superior. FDR was an improvement over Hoover, The Kennedy/Johnson years were better than Nixon/Ford, or even Eisenhower (who presided over three recessions). Clinton did better than either Bush, etc. You might argue that Reagan did much better than Carter, but even that was mostly on inflation, not real economic growth (which was strong under Clinton).
Of course some Republicans will respond by pointing to initiatives during the Clinton years that were undertaken by the GOP Congress, but that just proves my point that presidents are less consequential than we assume. And even that can’t explain why real GDP growth was twice as fast under Lyndon Johnson’s big government policies than under President Trump. So I conclude that even Republicans don’t really believe that the economy is a measure of the validity of a president’s ideology.
Here’s how I look at things:
1. There are long swings in trend real growth (per capita) due to technology. Growth was fastest when low hanging fruit from fundamental inventions like electricity and gasoline engines were being rolled out across the economy. Once that was mostly accomplished (around 1973), growth slowed.
2. Presidential policies do affect the supply side of the economy, and this can have a modest impact on growth. Some good reforms happened during the Reagan and Clinton years. This partly explains why the US switched from under-performing other developed countries to outperforming them in the later 1900s.
3. At business cycle frequencies, it’s mostly monetary policy that determines the path of output. Presidents do have the ability to pick Fed chairs, but they often re-nominate people originally picked by the other party. Monetary policy is relatively non-partisan.
The first point explains why Trump could never hope to achieve LBJ’s 5% real GDP growth rate. The second point explains about 10% of why Hoover did worse than Coolidge, and the third point explains about 90% of why Hoover did worse than Coolidge. (Technological growth was strong during the 1930s; it doesn’t explain any of Hoover’s dismal performance.)
If people want to think in terms of the “Obama economy” or the “Trump economy” that’s fine. But your vision is almost all in your head; it doesn’t really conform to what’s actually driving the economy. At best, maybe 3% of the economy.
PS. Here’s another example. Both 9/11 and the 2008 banking crisis happened to occur when George Bush and Blair/Brown were leading the US and UK. Tony Blair and Gordon Brown were basically the UK’s version of Bill Clinton. There’s a lot of luck in involved in how a president (or PM) goes down in history.
PPS. That graph really shows the weakness of job growth during the 2001-07 recovery. Which is odd because RGDP growth was fairly decent.
READER COMMENTS
Brian Donohue
Feb 14 2020 at 2:56pm
Americans increasingly vote for divided government, which works better than unified government. Reagan had to deal with a Democratic Congress for his entire administration, and Clinton had to deal with a GOP Congress for the last six years of his administration (Obama too). The Presidency of GWB was the only time we’ve had more than two consecutive years of unified government since Jimmy Carter. Not coincidentally, the GWB administration was the worst of my lifetime.
Brian Donohue
Feb 14 2020 at 2:59pm
Manufacturing employment has been in long-term decline for decades (Billy Joel wrote Allentown in 1979), but it really fell off a cliff in the early 2000s, shortly after China joined the WTO.
Scott Sumner
Feb 14 2020 at 6:33pm
Yes, but not BECAUSE China joined the WTO.
Thaomas
Feb 16 2020 at 7:44am
Even if you think that import competition/offshoring is an important driver of manufacturing employment, you need to distinguish policy changes (WTO) from falling costs of ocean sipping and communications and foreign countries like China and India adopting policies that less restricted exports.
Brian Donohue
Feb 14 2020 at 3:10pm
But yes, to your main point, politicians and central bankers can’t significantly move the needle on the economy in a positive way. The heroes of the graph above are millions of people distributed across the country. America continues to be an economically impressive place, even if we are at each others’ throats non-stop over politics.
Thaomas
Feb 16 2020 at 7:38am
Maybe not, but they certainly can move it in a negative way as the Fed proved in 2008 – and in a smaller way, the Administrations’ trade restrictions.
Lorenzo from Oz
Feb 14 2020 at 5:45pm
But the low-information swing voters who elect Presidents may believe precisely that, or at least act (i.e. vote) as if they do. Hence the success of such things as the Peace and Bread equation in predicting Presidential votes.
Scott Sumner
Feb 14 2020 at 6:34pm
If you are low information and Presidents control 3% of what happens to the economy, then it’s rational to look at the economy. Right?
You aren’t going to look at the CEA report on the economy. Or all the regulatory changes.
bill
Feb 15 2020 at 6:04am
The inflation irony is that it was Carter that appointed Volcker.
I found this interesting: https://www.businessinsider.com/ronald-reagan-fed-chair-volcker-trump-2018-10
Thaomas
Feb 15 2020 at 8:32am
I think it’s fair to attribute changes in long term growth to different administrations, which includes how they interact with Congress. The US will suffer long term from the higher deficits and reduced international trade caused by the Trump administration. It’s harder to say how much has been the real damage of anti-immigrant policies. Some high-profile changes in regulation have been negative, but possible below the surface improvements have been made. But none of this will show up in measurable growth during the quadrennium or even two.
Floccina
Feb 17 2020 at 11:48am
I assume that you wanted to say:
Comments are closed.