
The CPI inflation figures announced today were not much different from market expectations, but 10-year T-bond prices rose about 1% and yields declined to below 3.5% on the news. Why was the inflation report bullish for the bond market? I suspect it has something to do with the figures for shelter inflation, which came in at 0.8% month-over-month. But first a bit of perspective.
In July 2009, I did a post arguing that price indices should include “spot rents”, which are the rental cost of newly leased apartments. If the index includes rents on existing contracts, then the CPI will lag well behind actual changes in the price level. Here’s what I said in 2009, a period when house prices were falling rapidly:
At this point you may be wondering how the government could be so stupid as to think house prices have risen 2.1% over the past year. Well they may be stupid, but not THAT stupid. They are trying to measure something called the “rental equivalent” cost of housing. Yet by all accounts even monthly rents are falling rapidly. So why do they show 2.1% inflation of housing prices? I’m not sure; perhaps someone can answer these two questions:
1. Do they factor in the effect of deals that include one or two months of free rent? I don’t think they do. These are much more common during a downturn, and are disguised price cuts.
2. Do they survey all apartments, or just newly rented units? I hope it is the latter, as rents on older leases are not true prices at all, and should definitely not be included in any price index. They are analogous to monthly payments on a mortgage.
It turns out that the CPI is biased in just the way that I feared back in 2009; it relies on the average rent under existing contracts, not just new contracts.
More recently, this message seems to have filtered down to the Federal Reserve. This is from a Bloomberg article published about three weeks ago:
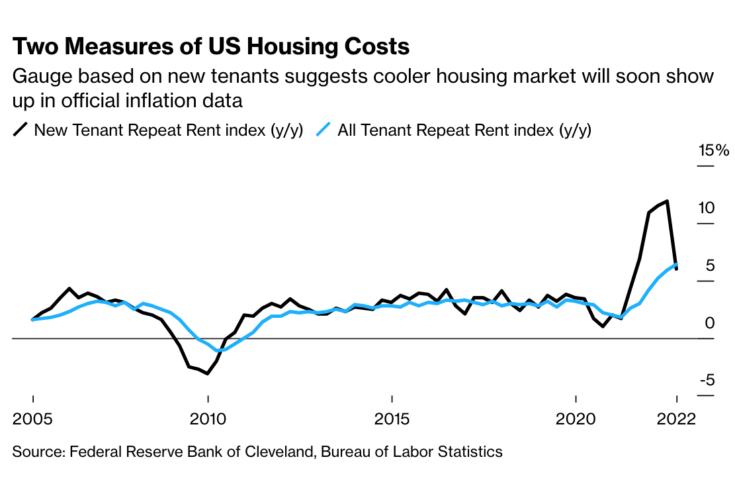
The cooldown in US housing should show up in official inflation data next year, according to a new index that aims to capture changes in rental markets without the usual lag.
Researchers at the Federal Reserve Bank of Cleveland and the Bureau of Labor Statistics built a gauge that’s based only on the leases of tenants who recently moved in, and compared it with another that measures the average of rents for all tenants.
Not surprisingly, the index on rents for new tenants is a leading indicator of future CPI inflation:
The results, according to a paper this month, show the new-tenant index is now dropping fast, from a peak around 12%. The researchers found that their new-tenant data tends to run ahead of BLS housing measures in the consumer price index by about one year, while for the all-tenant measure the gap is about one quarter.
So why was the 0.8% rise in housing costs good news? After all, that’s almost a 10% annual rate. The goods news can be broken down into two components:
1. Housing now explains almost all of the core CPI inflation.
2. In the spot market, housing inflation has already slowed sharply from its peak in mid-2022. This will show up in lower overall housing inflation later this year.
The overall figure for core inflation was 0.3% in January. Since housing is roughly 40% a third of the core CPI, the 0.8% rise in shelter prices suggests that almost all of the 0.3% core inflation in December was caused by housing. The rest of the index barely changed.
At first glance, it looks like I’m making a classic error—becoming optimistic about inflation by disregarding the fastest rising component of the CPI. People who did this during the 1970s (and 2021) ended up being consistently wrong. They’d say, “Yes, but if you take out the effects of X and Y, then inflation wasn’t so bad.” That’s faulty reasoning, as an average will always be lower if you take out the components that are above average. If there’s an underlying inflation problem, then some other component will take the lead in the next period.
I’m not discounting rental inflation because it’s higher than average, I’m discounting it because it’s being measured with a long lag. It’s the spot rents that matter when trying to figure out where housing inflation is headed going forward.
I still may end being wrong, but it won’t be because I’m making the classic mistake of discounting an unfavorable component, it will be because the rate of inflation in spot rents begins to re-accelerate. And that will depend on two other factors (which are closely related), nominal wages and nominal GDP.
Ultimately, rents are likely to follow the path of wages and NGDP. Rents rose fast during 2022 because wages and NGDP rose fast. To make permanent progress on rents we need to have permanently slower NGDP and nominal wage growth. (As an aside, of course more housing construction would be good and rent control would be bad, but the key to reducing (nominal) housing inflation is controlling NGDP growth.)
To summarize, I suspect the bond market was not particularly surprised by the 0.3% core inflation figure. Instead, I believe traders were pleasantly surprised to see that almost all of the core inflation was housing. Since we already know from the spot market that measured housing inflation is likely to slow later in 2023, the bond market treated this information as good news. But to make permanent progress against inflation, we still need to slow NGDP growth and nominal wage growth. There’s still more work to be done.
PS. Bloomberg provided this helpful graph:
READER COMMENTS
vince
Jan 12 2023 at 6:50pm
Thanks for the informative article. The rental price lag also says inflation for 2022 has been understated. As you wrote, more housing construction would help, but housing starts declined in 2022.
The drop in the 10 year Tbond yield mirrors the drop in the corresponding TIPS yields. That indicates the change is due to real rates.
Kevin Erdmann
Jan 14 2023 at 10:25pm
Housing is tricky to peg these days. Starts did decline, but starts had been above the current capacity for completions. So completions have been relatively stable throughout the Covid period and may remain stable even though starts have declined from their peak. Total starts have only just reverted back to the pace of completions.
Thomas Lee Hutcheson
Jan 12 2023 at 9:51pm
But not enough for TIPS to keep expecting the Fed to undershoot its target. I hope the Fed is paying attention.
Spencer
Jan 13 2023 at 12:30pm
The PPI peaked at 280.251 in June. It now stands at 263.235 in November.
…
The CPI peaked at 298.012 in October. It now stands at 296.797 in December.
…
Can services inflation have a different lag than goods inflation with the change in demographics?
Spencer
Jan 13 2023 at 2:27pm
That’s 22 months that the CPI has been above the FED’s 2% target. And in the last 21 months real wage income has fallen in concert. By that relationship maybe 2% was the appropriate target.
Andrew_FL
Jan 13 2023 at 11:25pm
It is not strictly a mistake for CPI or PCE to measure existing rents and not spot rents, since they are trying to measure something like a typical or average consumption basket, which at any given time will mostly be averaging a large number of existing renters with a small number of new renters. It is however important to be aware of the implications of this fact when setting expectations about inflation.
But isn’t the larger problem here backward looking policy?
Scott Sumner
Jan 14 2023 at 11:43am
Andrew, You said:
“It is not strictly a mistake for CPI or PCE”
Sure that’s a defensible view. But then why not look at monthly car payments on loans? Why focus on the price of new cars? Why not look at average mortgage payments? I don’t see any consistency.
David S
Jan 14 2023 at 5:23am
I’m still seeing the occasional claim that the housing market is about to collapse because of high interest rates or some such nonsense. Some people seem to have forgotten the dark times of 2008 when nearly all credit was frozen. The current corrections in CPI data are definitely welcome, but they continue to reveal how shelter rents are too damn high. Anyone who claims to be a policymaker should continue to be concerned about our persistent housing shortage.
D F Linton
Jan 14 2023 at 7:08am
This means of course that measured inflation before the midterms was understated since current rents peaked before smoothed rents.
Scott Sumner
Jan 14 2023 at 11:44am
Yes, but why focus on the midterms? Are you implying that politics played a role?
Thomas Lee Hutcheson
Jan 14 2023 at 2:55pm
The best single indicator are TIPS. Bot 10 and 5 year rates expect inflation to be below target. I hope that just means that traders expect the Fed to continue raising ST rates an produce a recession but that the Fed will surprise them.
Comments are closed.