The Noise-to-signal Ratio as a Metaphor for the Deadweight Loss of Taxes
By Cyril Morong
A useful metaphor for understanding the disproportionate damage to economic efficiency caused by rising taxes is the noise-to-signal ratio (NSR). The NSR is the reverse of what is called the signal-to-noise ratio in electronics. Here is a definition:
The ratio of the power or volume (amplitude) of a signal to the amount of disturbance (the noise) mixed in with it. Measured in decibels, signal-to-noise ratio (SNR, S/N) measures the clarity of the signal in a circuit or a wired or wireless transmission channel.2
The NSR, which many people understand more intuitively from physics, sheds light on the DWL in economics. As I explain below, while the NSR does not literally meet the Mankiw challenge, it does come close: it illustrates that each tax increase hurts economic efficiency more than the previous one.
Noises and Prices
“The more distorted the signal, the less efficient prices become in allocating resources.”
A basic insight from economics is that prices are signals that reveal the value or scarcity of resources; this helps people use them efficiently. But taxes can be seen as the noise that distorts that signal. The more distorted the signal, the less efficient prices become in allocating resources. As I show in the accompanying graphs, when a per unit tax is placed on a good, the price the sellers receive (that is, the amount they get to keep after they pay the tax to the government) falls while the price the consumers pay rises. This tax “wedge” distorts the market because it causes buyers and sellers to face two different prices for the same item: the buyer pays the price gross of tax while the seller receives a price that is net of tax. The larger this tax wedge, the greater is the distortion. In my metaphor, the greater is the noise. If you are listening to the radio and start hearing noise or static, the signal starts to lose its value. Eventually, the noise overwhelms the signal, and there is no longer a reason to listen since the NSR is so high. The same thing happens with taxes: as the NSR rises, the DWL rises at a similar rate. Thus, the NSR helps illustrate how rising taxes increasingly damage economic efficiency.
Consider the income tax. The income you are paid for your services is based on the price for your services and, therefore, signals the value of those services. But taxes reduce the clarity of that signal by reducing how much of your pay you actually get to keep. Thus, the taxes are noise. As taxes increase, the noise-to-signal ratio in the economy increases even more. Distortions, as well as the misallocation of resources they cause, increase disproportionately. For example, if the income tax rate is 10%, you keep 90% of your income. The noise-to-signal ratio is .111 (or .1/.9). But if the tax rate goes up by .10, or to 20%, the noise-to-signal ratio goes up even more, by .15 to .25, since you keep only 80% of your income. The .25 comes from .20/.80. Another .10 increase in the tax rate increases the noise-to-signal ratio by .179, from .25 to .429. Then, going from a 30% tax rate to a 40% tax rate makes it go up by .238, from .429 to .667.
Now let’s see how DWL works generally so that we can compare it to NSR.
DWL is the loss of social welfare from taxes. Social welfare is the sum of consumer surplus and producer surplus. Consumer surplus is the amount that consumers are willing to pay for a product minus the amount that they actually pay. For example, if you buy a shirt for $10 but would have been willing to pay $22, you get $12 of consumer surplus. Producer surplus is the difference between the cost to make a product and the amount the firm gets for selling it. If it costs the firm $5 to make a shirt, and the firm sells it for $12, the firm gets $7 in producer surplus.
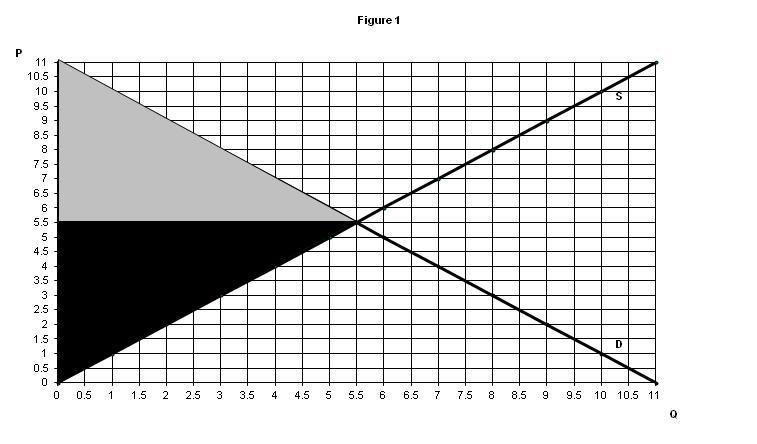
The total amount of consumer surplus and producer surplus in a market—and, therefore, social welfare—is represented in areas found in a typical supply and demand graph. In Figure 1, the equilibrium price is $5.50 and the quantity is 5.5. The consumer surplus is the gray triangle and its area is $15.125. The producer surplus is the black triangle and its area is also $15.125. So the social welfare is $30.25. Social welfare is the total benefit that society gets from consuming and producing a good. There is no DWL since there is no tax.
Figure 1.
A $1 per unit tax causes the supply line to shift up by that amount of the tax since sellers now need $1 more for each unit that they offer for sale. Figure 2 shows this with the consumer surplus and producer surplus shaded in (the new supply line is S’).
Figure 2.
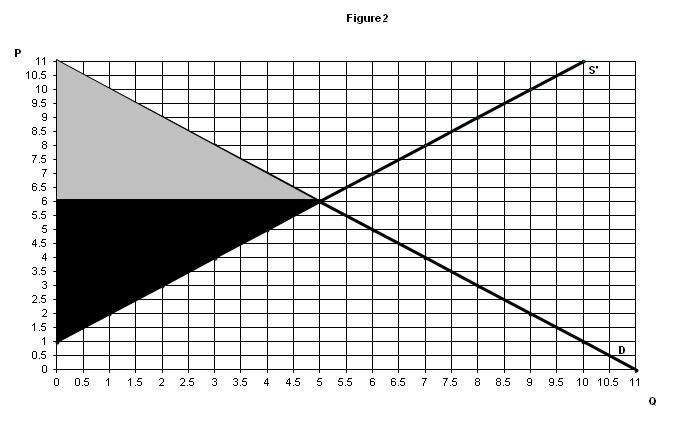
The new price is $6 and the new quantity is 5. Consumer surplus and producer surplus are $12.50. Social welfare is not $25 because we have to add in the tax revenue of $5. This assumes, of course, that the government uses the $5 in tax revenue to buy items that are worth $5 to society. So social welfare is $30, but it was $30.25 before the tax. This $0.25 is the DWL.3 Therefore, society is worse off as a result of the tax.
If we double the tax to $2, the supply line will have to shift up by another $1. Doing the same calculations as above, the social welfare becomes $29.25—recall that it was $30.25 before any taxes. Now, the DWL is $1—four times the DWL of $0.25 when the tax was $1. As mentioned above, when a tax is doubled, the DWL quadruples. This is how rising taxes cause inefficiency to rise at an even higher rate.
Table 1 summarizes what happens at all tax levels.
| Table 1 | |
|---|---|
| Tax | DWL |
| 0 | 0 |
| 1 | 0.25 |
| 2 | 1 |
| 3 | 2.25 |
| 4 | 4 |
| 5 | 6.25 |
| 6 | 9 |
| 7 | 12.25 |
| 8 | 16 |
| 9 | 20.25 |
| 10 | 25 |
Notice that if the tax is $3, the DWL is $2.25, which is nine times as much as it is when the tax is 1. So triple the tax and the DWL increases by 8 times. If the tax were $11, the quantity would be 0, meaning that there would no longer be a market and, of course, the social welfare would be zero, as well.
The Close Parallel Between NSR and DWL
How well does this parallel the NSR explained earlier?
First, we have to see what price the sellers actually get at each tax level. When the tax is $1 per unit, the price is $6, but the sellers do not keep all of that. They must turn $1 over to the government, leaving them with $5. What the sellers have left after paying the tax is called the producer price. This is like your after-tax income under an income tax. Since the sellers got $5.50 before there was a tax, and now they keep only $5, their share of the tax is $0.50. Call that the producer tax. So the NSR is .5/5, which is .10 (the tax divided by the producer price). When the tax is $2, the producer tax is $1 (the sellers always pay half of the tax in this case). Then, the producer price is $4.5. So the NSR is 1.0/4.5 or .222. Note that the tax doubles, but the NSR more than doubles.
Table 2 shows how the NSR rises at each tax level, using the same type of calculations as above. In this table, the NSR is the ratio of the tax to producer price.
| Table 2 | ||
|---|---|---|
| Tax | NSR | DWL |
| 0 | 0 | 0 |
| 1 | 0.1 | 0.25 |
| 2 | 0.222 | 1 |
| 3 | 0.375 | 2.25 |
| 4 | 0.571 | 4 |
| 5 | 0.833 | 6.25 |
| 6 | 1.2 | 9 |
| 7 | 1.75 | 12.25 |
| 8 | 2.667 | 16 |
| 9 | 4.5 | 20.25 |
| 10 | 10 | 25 |
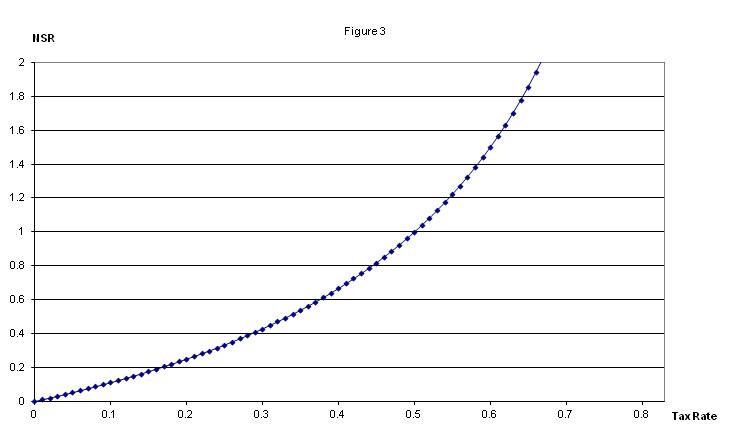
Figure 3 shows how the NSR rises as the tax rises (based on the earlier income tax example). Notice that the relationship is non-linear: when taxes increase, inefficiency increases even more.
Figure 3.
But there is a similar relationship between the tax and DWL, as Figure 4 shows.
Figure 4.
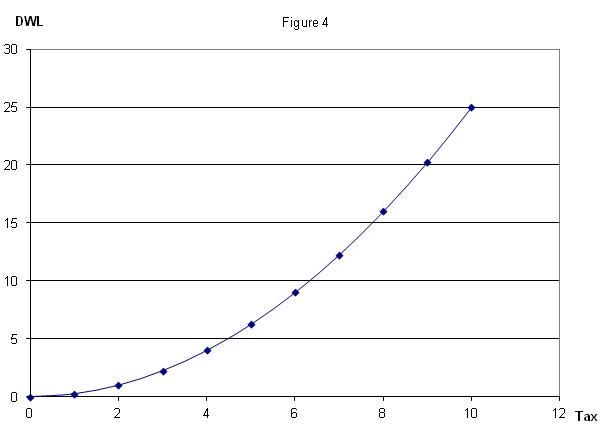
Figures 3 and 4 illustrate how closely the NSR parallels DWL as taxes rise, making NSR a good way to easily summarize the inefficiency of rising taxes. Both DWL and NSR show a similar non-linear pattern: inefficiency due to taxes rises faster than taxes rise.
The noise-to-signal ratio is a metaphor that should help students of economics understand the deadweight loss from taxes because it succinctly summarizes a complex idea. The NSR, like the DWL, rises faster than the tax rate. So the next time you hear someone advocate increasing a tax, remember that he is saying that he wants, or, at least, is willing to accept, an increase in the noise-to-signal ratio.
“An Expositional Challenge,” Greg Mankiw’s Blog, November 22, 2006.
PC Magazine Encyclopedia: Definition of: signal-to-noise ratio.
If the government uses the tax revenue to generate value that is more than the tax revenue plus $0.25, then the tax does not cause DWL. But in reality it is often hard to know if the benefit of the government services provided outweighs the cost of the DWL. Indeed, it is difficult to know if the government is providing services worth even the amount of the tax revenue, let alone the tax revenue plus DWL. The point here is that each additional tax is actually more costly than the previous one. So for any tax increase to be worth it, the value of the next unit of government services the tax pays for must exceed the value of the previous unit. Again, this is hard to prove in the real world, but it seems unlikely in many cases.
*Cyril Morong teaches economics at San Antonio College in San Antonio, Texas. His Ph.D. is from Washington State University. When he is not doing economics he is doing sabermetrics.