Pollsters ask the public all sorts of questions about their political beliefs. But what does the public actually believe? Is there any reason to assume that people are responding truthfully to the questions asked by pollsters?
That may seem like an odd question. Why would people lie to pollsters? I’m not sure, but there is evidence that they do lie about their beliefs. Reason magazine has an excellent article by Ronald Bailey, which discusses the tribal nature of expressed views on factual questions with political implications:
A 2015 study in the Quarterly Journal of Political Science sought to distinguish partisan cheerleading from sincere partisan divergence. The Northwestern University political scientist John Bullock and his colleagues found that offering participants small payments for giving correct and “don’t know” answers to politically salient questions reduced the partisan gap between Republicans and Democrats by about 80 percent.
“To the extent that factual beliefs are determined by partisanship, paying partisans to answer correctly should not affect their responses to factual questions. But it does,” they observe. “We find that even modest payments substantially reduce the observed gaps between Democrats and Republicans, which suggests that Democrats and Republicans do not hold starkly different beliefs about many important facts.”
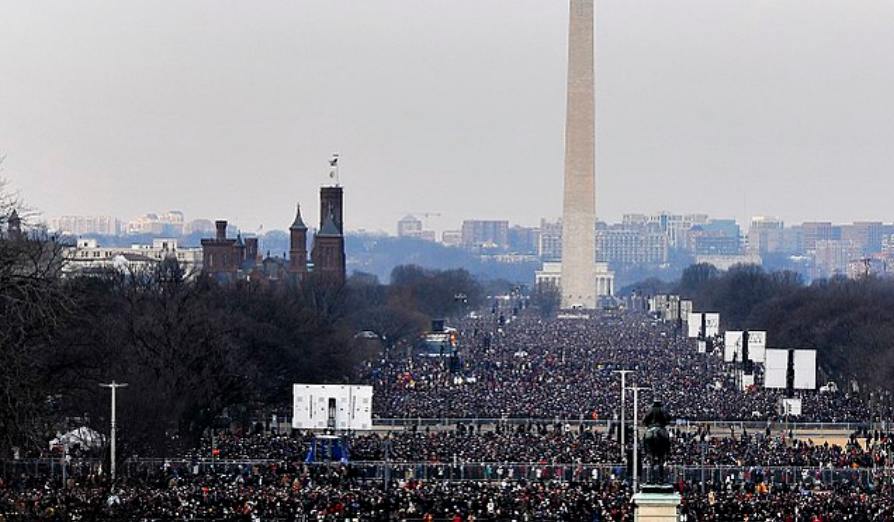
The article cites another academic study that reported some truly astounding results after people were shown pictures of the modest crowds at the Trump inauguration and the large crowds at the Obama inauguration:
But are partisans really seeing different things? Perhaps they are mostly cheerleading their team rather than asserting actual beliefs. This is the thesis explored by the University of Nottingham philosopher Michael Hannon in a 2020 paper for Political Epistemology. He points to a survey of nearly 1,400 Americans conducted in January 2017. Researchers showed half of the respondents photos, simply labeled A and B, of the crowds on the National Mall during Barack Obama’s 2009 inauguration and Donald Trump’s 2017 inauguration. They were asked which photo depicted the crowd for each president. Forty-one percent of Trump voters said the photo with the larger crowd depicted the Trump inauguration, which was actually the one from the Obama inauguration. Only 8 percent of Hillary Clinton voters picked the wrong photo. The researchers argue that it is likely that Trump voters picked the photo with the larger crowd as a way to express their partisan loyalties and show their support for him.
More tellingly, the researchers asked the other half of the respondents which photo depicted the larger crowd. One answer was clearly correct. But Trump voters were seven times more likely (15 percent) than Clinton voters (2 percent) to assert that the much less populous photo of Trump’s inauguration had more people. Remarkably, 26 percent of Trump voters with college degrees answered incorrectly. “When a Republican says that Trump’s inauguration photo has more people, they are not actually disagreeing with those who claim otherwise. They’re just cheerleading,” argues Hannon. “People are simply making claims about factual issues to signal their allegiance to a particular ideological community.”
Former EconLog blogger Bryan Caplan occasionally bets with people on specific factual questions, because he felt that people have less incentive to engage in wishful thinking when money is on the line. These academic studies provide support for Bryan’s claim that people don’t always believe what they say they believe.
Robin Hanson has argued that some public policy decisions should be guided by prediction markets, and I have specifically advocated using NGDP futures markets to guide monetary policy. Public policy is likely to be more effective when based on views that will prove costly if incorrect.
PS. In a recent post, I reported this story:
In 2006, lawmakers passed a bill banning almost all abortions, which Gov. Mike Rounds signed. It set off a brutal campaign that became the dominant issue in a busy election year that featured a governor’s race and 10 other ballot issues. Voters rejected the ban by 56% to 44%.
Abortion opponents decided to make another run in 2008, collecting enough signatures to return abortion to the ballot. The key difference between the two measures was that the 2008 effort included exceptions for rape and the mother’s health. Opponents figured the lack of exceptions in 2006 had doomed their efforts.
They were wrong. The 2008 vote was nearly identical to 2006, with 55% rejecting the measure.
I suspect they were wrong because they took seriously poll results that suggest a wide range of views on abortion. If you give people 4 or 5 options to choose from, the responses will spread out among these options. People don’t like to sound extreme or unreasonable. But in a binary up and down vote, it turns out that people are simply pro-life or pro-choice, with very little in between.
PPS. North Dakota had a similar referendum, with a similar result.
READER COMMENTS
Joel Pollen
Jun 28 2022 at 4:21pm
Great post. While I think laboratory psychology experiments in general have very limited external validity, the “cheerleading” results are really interesting. And I suppose taking part in a text-based psychology experiment is pretty similar to being polled.
A la the first study, though, I think the fact that there’s no “guessing penalty” is an even bigger problem. Why would it matter if 51% of people support something if most of them have never given it serious thought before the moment of the poll?
Radford Neal
Jun 29 2022 at 12:17am
First, just to be clear, I know nothing whatever about whether Obama or Trump attracted a larger inauguration crowd.
That said, the study about people making claims about this seems rather flawed. These crowds presumably gather over hours, and are denser in some places than others (maybe not the same places at two different events). So two pictures, one of Obama’s crowd, and one of Trump’s crowd, provide very little valid evidence about who’s crowd was larger (at the high point).
So I don’t think you need to attribute opinions contrary to the photos to partisan bias so extreme it overrides what there own eyes can see. It’s pretty obvious that the two photos mean little, so they may just stick with their prior opinions, quite justifiably.
The real puzzle is why anyone cares. With all the lying politicians do, about very consequential things, is lying about how big a crowd they attracted really a sensible thing to focus on?
Scott Sumner
Jun 29 2022 at 1:46am
You missed the whole point of the article. Of course no one cares which crowd was larger. Please read it again.
Radford Neal
Jun 29 2022 at 2:53pm
I’d take this part to be the relevant summary: “When a Republican says that Trump’s inauguration photo has more people, they are not actually disagreeing with those who claim otherwise. They’re just cheerleading”.
But an alternative interpretation is that they actually believe that Trump’s crowd was larger, and answer the way they do because they don’t want to seem to say otherwise by acknowledging that the single photo they’re shown of Trump’s crowd has fewer people, even though that photo clearly does have fewer people than the single photo of Obama’s crowd. The point being that they do not accept the photos as being representative, but the context of the experiment does not allow them to express that belief directly.
Kevin Corcoran
Jun 29 2022 at 11:07am
That depends on what you mean. Certainly it’s not the most sensible thing to focus on at the exclusion of all other things. But I do think it’s deserving of at least some attention, specifically because the subject being lied about is so trivial. That does provide information worth considering. You correctly point out that politicians lie about things of significant consequence. But it also says something about a person when they lie frequently, and seemingly compulsively, about things of little to no importance. If someone is talking about something of little relevance, that has no large impact or implications on things that matter, not even their own agenda, and they still can’t bring themselves to speak honestly about it and feel the need to engage in transparent and ego-puffing lies, then that seems pretty significant to me. If someone can’t even be honest when the stakes are so low as to be utterly trivial, then I have no ability to trust their honesty when it comes to things that matter a great deal.
Radford Neal
Jun 29 2022 at 3:02pm
But just about all politicians lie about such things all the time. How often have you heard a politician asked about poll results showing that they’re going to lose the upcoming election, who responds that they’re very confident of winning, because they’ve been talking to voters, and know that their message is starting to get out, and resonates with voters who are tired of the blah, blah, blah. They more-or-less have to say that, in order to avoid demoralizing their campaign workers. But of course they don’t believe it.
So lies about how great their support is don’t distinguish one politician from another.
Thomas Lee Hutcheson
Jun 29 2022 at 7:45am
Anyone who has argued with anyone about anything will know the other person will adduce facts that the believe only becasue it favors their side.
One of the reasons not to argue with people who (still, it’s becoming less common) do not “believe” that human activity is raising the harmful concentration of CO2 in the atmosphere (not argue THAT issue) is that generally they don’t really believe it, but are really just opposing what they think are very costly/liberty-encroaching countermeasures.
“Born in Kenya” is an even better example
Mark Z
Jun 29 2022 at 1:55pm
The crowd question is a cherry-picked example. Right after discussing it, the Reason article you cite then discusses another study where they did the same thing, only over public policy questions related to things like immigration and gun control. The results were the opposite:
“The researchers offered another set of respondents a small monetary incentive for providing accurate answers, along with access to the various news sources. Even with the incentive, they found, “roughly 60 to 70 percent of the initial partisan differences remain.” That is evidence for some cheerleading, but it also suggests that most partisans sincerely believe factually inaccurate claims.”
So, no, on questions about things that actually matter, differences in opinion probably are not merely partisan cheerleading.
Scott Sumner
Jun 29 2022 at 2:21pm
You have a very odd definition of “opposite”. I’d say the results were quite similar.
Floccina
Jun 29 2022 at 3:14pm
Also it is often neglected that with such polls people will often make a mistake and vote for what they do not want. IMHO it’s always good to put an absurd answer in there and whatever percent that gets reduce all other answers by that amount. I’ve accidentally answered wrong in polls.
Also it amazes me how vigorously partisans will fight over non-essentials. I’m more like sure you are correct about x but my values make me go with y anyway.
Aleksander
Jul 1 2022 at 8:40am
Alternatively, people vote in the same virtue-signaling way that they respond to polls. The contents of the ballot measure might be less important than the fact that there is one clear option for Team A, and one for Team B.
Comments are closed.