Recessions
By Geoffrey Moore

Although the definition worked quite well in this instance, there are several problems with it. One is that it does not provide monthly dates of when recessions began or ended. For this purpose the National Bureau of Economic Research (NBER), whose chronology of recessions is widely accepted, uses monthly measures of production, employment, sales, and income, all expressed in real terms (after allowing for inflation). GNP figures are not available monthly. The NBER found that the latest recession, from business cycle peak to trough, ran from July 1990 to March 1991.
Another problem with the two-consecutive-quarters definition is that there can be serious declines in economic activity even without two consecutive quarters of negative growth. Suppose that in one period, real GNP declines 5 percent in the first quarter, rises 1 percent in the second, and declines 5 percent again in the third. In another period let’s say real GNP declines 1 percent in each quarter. Obviously the first period shows a much more serious drop in GNP, but only the second period qualifies as a recession according to the definition.
These and other considerations have led the NBER to use a broader definition of recessions, which takes into account three dimensions of the decline in aggregate economic activity—its depth, duration, and diffusion across industries. These are known as the three Ds. Measures of this sort for several recent recessions are shown in table 1. This broader concept has also been applied to a much longer period, covering two hundred years of U.S. history (see chart 1).
|
TABLE 1 |
||||
|
The Three Ds of Recession: A Brief History |
||||
|
Duration |
Depth |
Diffusion |
||
| Months | Percent Change in Real GNP | Unemployment Rate, maximum | Percent of Industries with Declining Employment, maximum | |
| Three Depressions | ||||
| Jan. 1920-July 1921 | 18 | n.a. | 11.9 | 97 |
| Aug. 1929-Mar. 1933 | 43 | -32.6 | 24.9 | 100 |
| May 1937-June 1938 | 13 | -18.2 | 20.0 | 97 |
| Six Sharp Recessions | ||||
| May 1923-July 1924 | 14 | -4.1 | 5.5 | 94 |
| Nov. 1948-Oct. 1949 | 11 | -1.5 | 7.9 | 90 |
| July 1953-May 1954 | 10 | -3.2 | 6.1 | 87 |
| Aug. 1957-Apr. 1958 | 8 | -3.3 | 7.5 | 88 |
| Nov. 1973-Mar. 1975 | 16 | -4.9 | 9.0 | 88 |
| July 1981-Nov. 1982 | 16 | -2.6 | 10.8 | 72 |
| Five Mild Recessions | ||||
| Oct. 1926-Nov. 1927 | 13 | -2.0 | 4.4 | 71 |
| Apr. 1960-Feb. 1961 | 10 | -1.2 | 7.1 | 80 |
| Dec. 1969-Nov. 1970 | 11 | -1.0 | 6.1 | 80 |
| Jan. 1980-July 1980 | 6 | -2.5 | 7.8 | 63 |
| July 1990-March 1991 | 8 | -1.2 | 6.9 | 73 |
| Averages | ||||
| 1920-1938 (5) | 20 | -14.2 | 13.3 | 92 |
| 1948-1991 (9) | 11 | -2.4 | 7.7 | 80 |
|
SOURCE: Based on table A-2 in G. H. Moore, Business Cycles, Inflation and Forecasting, 2nd ed., 1983. Note that the brief and mild recession of 1945 is omitted here. |
||||
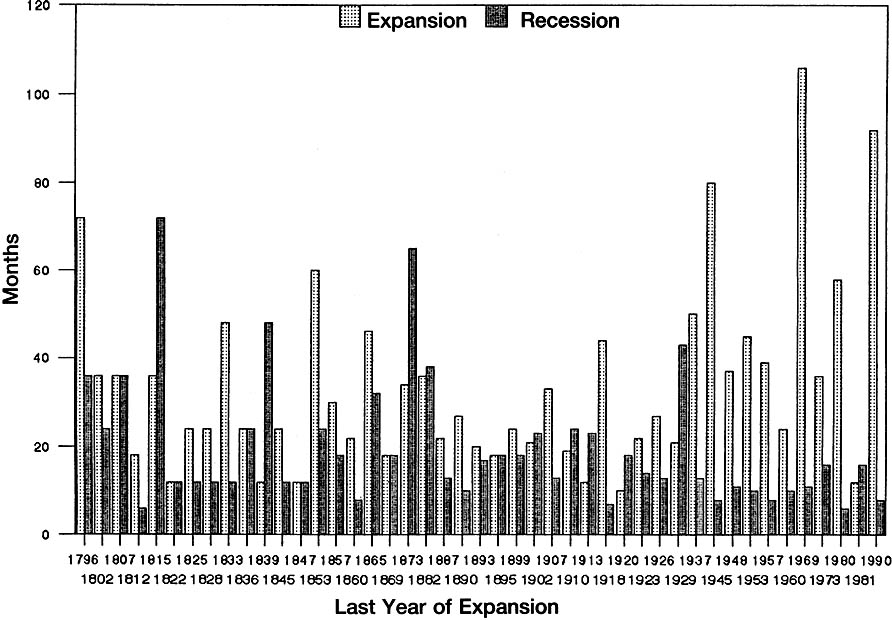
Chart 1. Length of Business Recessions and Expansions
United States, 1790-1991
SOURCE: Compiled from data supplied by the National Bureau of Economic Research Center for International Business Cycle Research, January 1993.
Enlarge in new window
Recessions have a global as well as domestic dimension. Financial markets in many countries are closely watched in other countries, and many investors are making investments on an international scale. Exports and imports have become more important to business enterprises, and managements must now deal with global competition. As a result periods of recession are likely to encompass many countries at about the same time. During recessions in the United States, a majority of the industrial countries in Europe and the Pacific are apt to show signs of recession also. This, in turn, has depressing effects on the United States by slowing the foreign demand for U.S. exports.
The upshot is that even though recessions are not as severe as they used to be, they have serious consequences in many directions. Some industries, some occupations, and some areas of the country are hit much harder than others. Hence, it pays to keep close watch on them with all the daily, weekly, monthly, and quarterly data that are available for that purpose.
Geoffrey H. Moore is the director emeritus of the Center for International Business Cycle Research, Columbia University, New York.
Burns, Arthur F., and Wesley C. Mitchell. Measuring Business Cycles. 1946.
Center for International Business Cycle Research. Recession-Recovery Watch. Monthly.
Gordon, Robert J., ed. The American Business Cycle: Continuity and Change. 1986.
Moore, Geoffrey H. Business Cycles, Inflation, and Forecasting. 1983.
Moore, Geoffrey H. Leading Indicators for the 1990s. 1989.
U.S. Department of Commerce. Survey of Current Business. Monthly.