Welfare
By Jeffrey M. Jones and Thomas MaCurdy

The U.S. welfare system would be an unlikely model for anyone designing a welfare system from scratch. The dozens of programs that make up the “system” have different (sometimes competing) goals, inconsistent rules, and over-lapping groups of beneficiaries. Responsibility for administering the various programs is spread throughout the executive branch of the federal government and across many committees of the U.S. Congress. Responsibilities are also shared with state, county, and city governments, which actually deliver the services and contribute to funding.
The six programs most commonly associated with the “social safety net” include: (1) Temporary Assistance for Needy Families (TANF), (2) the Food Stamp Program (FSP), (3) Supplemental Security Income (SSI), (4) Medicaid, (5) housing assistance, and (6) the Earned Income Tax Credit (EITC). The federal government is the primary funder of all six, although TANF and Medicaid each require a 25–50 percent state funding match. The first five programs are administered locally (by the states, counties, or local federal agencies), whereas EITC operates as part of the regular federal tax system. Outside the six major programs are many smaller government-assistance programs (e.g., Special Supplemental Food Program for Women, Infants and Children [WIC]; general assistance [GA]; school-based food programs; and Low-Income Home Energy Assistance Program [LIHEAP]), which have extensive numbers of participants but pay quite modest benefits.
Welfare reform, brought about through the passage of the Personal Responsibility and Work Opportunity Reconciliation Act (PRWORA) of 1996, significantly altered the rules for delivering income support, but it was narrowly focused on one program. The 1996 law replaced Aid to Families with Dependent Children (AFDC) with TANF. SSI and food stamps were also affected, but to a much lesser extent.
Key Programs
The accompanying figures summarize trends in the coverage and expenses of the six major federal safety-net programs over the past three decades. Figure 1 shows the percentage of the American population receiving benefits from each program, and Figure 2 presents the share of federal expenditures spent on each program. The bars in Figure 1 also plot the percentage of Americans classified as being in poverty. In addition to highlighting the evolution of these U.S. welfare programs, the following discussion briefly describes the forms of benefits paid out by programs, along with eligibility criteria.

Temporary Assistance for Needy Families pays cash assistance to single-parent or unemployed two-parent families for a limited term. The program also significantly funds job training and child care as a means to discourage welfare dependency and encourage work.
The origins of TANF are in the Social Security Act of 1935, which established the Aid to Dependent Children (ADP) program. ADP enabled state governments to help single mothers who were widowed or abandoned by their husbands. It was originally designed to allow mothers to stay at home and take care of their children, providing cash benefits for the basic requirements of food, shelter, and clothing. The program was expanded in the 1950s and 1960s to provide cash assistance to needy children and families regardless of the reason for parental absence. This expansion coincided with renaming the program Aid to Families with Dependent Children. While AFDC was principally a federal program managed by the Department of Health and Human Services, it was administered through state-run welfare offices. Indeed, states were responsible for organizing the program, determining benefits, establishing income and resource limits, and setting actual benefit payments. With relatively little flexibility, an AFDC program in New York City looked a lot like its counterpart in Reno, Nevada, apart from differences in the maximum amount each state paid to a family for assistance. Funding for AFDC was shared between the federal and state governments, with the feds covering a higher portion of AFDC benefit costs in states with lower-than-average per capita income. As with many other welfare programs, AFDC’s costs were not capped because the program was an “entitlement”—meaning that qualified families could not be refused cash assistance.
By the early 1990s, many policymakers were seeking alternatives to AFDC. Although the average monthly benefit in 1995 was only $376.70 per family and $132.64 per recipient, 40 percent of applicants remained on welfare for two years or longer. In response to this dependency, in 1996, Congress passed and President Bill Clinton signed the Personal Responsibility and Work Opportunity Reconciliation Act, which replaced AFDC with TANF. Under the new program, the federal government eliminated the entitlement to cash welfare, placed limits on the length of time families could collect benefits, and introduced work requirements. By law, a family cannot receive TANF benefits for more than a lifetime limit of five years, cumulative across welfare spells. Regarding work requirements, TANF mandated that at least 50 percent of recipients participate in “work” activities by 2002, with activities including employment, on-the-job training, vocational education, job search, and community service. Together, these activities must account for thirty hours per week for a single parent. Recipients who refuse to participate in work activities must be sanctioned, resulting in a loss of cash benefits. Enforcement of sanctions could include immediately suspending all cash payments, stopping support only after multiple episodes of noncompliance, or only partially reducing grants to families who fail to cooperate. States could, and in fact did, introduce more stringent requirements for families to work or participate in educational activities to qualify for cash payments. TANF cemented the primary emphasis on getting welfare recipients into jobs.
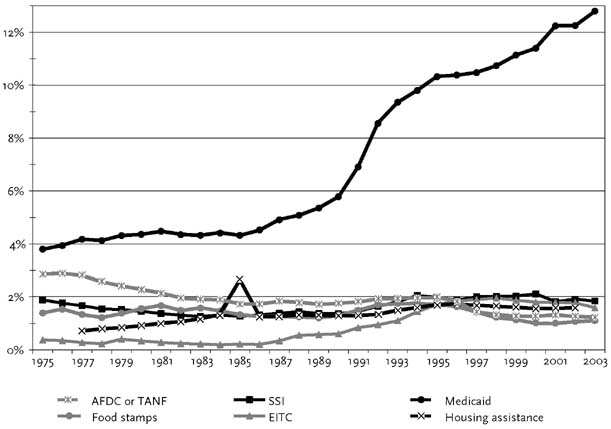
Figures 1 and 2 reveal that growth in neither costs nor enrollments motivated the passage of welfare reform in 1996. Program expenditures have accounted for less than 3 percent of the federal budget since 1975. The caseload remained relatively stable until the mid-1990s. After welfare reform, however, the welfare caseload and welfare spending as a percentage of government spending dropped sharply.
The Food Stamp Program, authorized as a permanent program in 1964, provides benefits to low-income households to buy nutritional, low-cost food. After 1974, Congress required all states to offer the program. Recipients use coupons and electronic benefits transfer (EBT) cards to purchase food at authorized retail stores. There are limitations on what items can be purchased with food stamps (e.g., they cannot be used to purchase cigarettes or alcohol). Recipients pay no tax on items purchased with food stamps. The federal government is entirely responsible for the rules and the complete funding of FSP benefits under the auspices of the Department of Agriculture’s Food and Nutrition Service (FNS). State governments, through local welfare offices, have primary responsibility for administering the Food Stamp Program. They determine eligibility, calculate benefits, and issue food stamp allotments.
Welfare reform imposed work requirements on recipients and allowed states to streamline administrative procedures for determining eligibility and benefits. Childless recipients between the ages of eighteen and fifty became ineligible for food stamps if they received benefits for more than three months while not working. According to Figure 1, the FSP caseload has included between 6 and 10 percent of the U.S. population, following a cyclical pattern before welfare reform: during recessions, the caseload percentage was higher. Welfare reform caused a decline in the FSP caseload percentage.
Supplemental Security Income, authorized by the Social Security Act in 1974, pays monthly cash benefits to needy individuals whose ability to work is restricted by blindness or disability. Families can also receive payments to support disabled children. Survivor’s benefits for children are authorized under Title II of the Social Security Act, not Title XVI, and are, therefore, not part of the SSI program. Although one cannot receive SSI payments and TANF payments concurrently, one can receive SSI and Social Security simultaneously. (In 2003, 35 percent of all SSI recipients also received Social Security benefits, and 57 percent of aged SSI recipients were Social Security beneficiaries.) The average SSI recipient received almost $5,000 in annual payments in 2003, with the average monthly federal payment being $417, and many state governments supplemented the basic SSI benefits with their own funds.
Welfare reforms and related immigration legislation in 1996–1997 sought to address three areas of perceived abuse in the SSI program. First, the legislation set up procedures to help ensure that SSI payments are not made to prison inmates. Second, the legislation eliminated benefits to less-disabled children, particularly children with behavioral problems rather than physical disorders. Finally, new immigrants were deemed ineligible for benefits prior to becoming citizens.
Medicaid became law in 1965, under the Social Security Act, to assist state governments in providing medical care to eligible needy persons. Medicaid provides health-care services to more than 49.7 million low-income individuals who are in one or more of the following categories: aged, blind, disabled, members of families with dependent children, or certain other children and pregnant women. Medicaid is the largest government program providing medical and health-related services to the nation’s poorest people and the largest single funding source for nursing homes and institutions for mentally retarded people.
Within federal guidelines, each state government is responsible for designing and administering its own program. Individual states determine persons covered, types and scope of benefits offered, and amounts of payments for services. Federal law requires that a single state agency be responsible for the administration of the Medicaid program; generally it is the state welfare or health agency. The federal government shares costs with states by means of an annually adjusted variable matching formula.
The Medicaid program has more participants than any other major welfare program. More than 17 percent of the population received Medicaid benefits in 2002, up from about 10 percent in the 1970s and 1980s. Spending on Medicaid has risen steadily as a fraction of the federal budget, increasing from approximately 2 percent in 1975 to 13 percent in 2002. Total outlays for the Medicaid program in 2002 (federal and state) were $259 billion, and per capita expenditures on Medicaid beneficiaries averaged $4,291.
Housing assistance covers a broad range of efforts by federal and state governments to improve housing quality and to reduce housing costs for lower-income households. The Department of Housing and Urban Development (HUD) and the Federal Housing Administration (FHA) administer most federal housing programs. Under current programs, each resident pays approximately 30 percent of his or her income for rent.
In terms of welfare policy, there are two principal types of housing assistance for low-income families: subsidized rent and public housing. The federal government has provided rental subsidies since the mid-1930s and today funds the HUD Section 8 voucher program. Local governments commonly provide for subsidized housing through their building authority in that they require a portion of new construction to be made available to low-income families at below-market rents. Public housing (the actual provision of dwellings) is almost exclusively a federal program administered by local public housing agencies (PHAs), not private owner-managers. In contrast to the mid-1960s, public housing now accounts for a small fraction of overall housing assistance.
Earned Income Tax Credit, enacted in 1975, pays a refundable tax credit for working Americans with low earnings. The tax credit increases family income by supplementing earnings up to a fixed level. The program was initially designed to offset the impact of Social Security taxes on low-income individuals and to encourage individuals to seek employment rather than rely on welfare benefits. Because EITC is part of the regular federal income tax system, receiving benefits is private, unremarkable, and without stigma. In 2004, the EITC paid out $33.1 billion to approximately 18.6 million claimants—several billion dollars more than the amounts projected to be spent on other primary programs such as TANF and food stamps. EITC is one of the few programs that effectively reach the eligible population. Analysis of EITC claims in 1999 shows that 86 percent of eligible families with children received the credit. (In contrast, only 66 percent of eligible households with children received food stamp benefits in 1999.) Although the EITC is generally paid all at once as an annual refund, it can also be included with an employee’s weekly, biweekly, or monthly paycheck.
|
|
|||||||||||
| Program Payments | Tax Costs | Disposable Income | |||||||||
| Earnings($) | TANF | Food Stamps | SSI | Sec. 8Housing | Federal EITC | Health Care | Federal Payroll Taxes | Federal Income Tax | Taxes, EITC | Taxes, EITC, TANF, FSP | Taxes, EITC, TANF, FSP,Sec. 8 |
| 0 | 8,148 | 5,988 | 9,660 | 10,800 | 0 | MNP | 0 | 0 | 0 | 12,663 | 20,611 |
| 4,000 | 7,498 | 5,510 | 8,170 | 9,400 | 1,600 | MNP | −306 | 0 | 5,294 | 16,503 | 23,279 |
| 8,000 | 5,498 | 4,550 | 6,170 | 8,000 | 3,200 | MNP | −612 | 0 | 10,588 | 19,317 | 25,393 |
| 12,000 | 3,498 | 3,590 | 4,170 | 6,600 | 4,300 | MNP | −918 | 0 | 15,382 | 21,631 | 27,007 |
| 16,000 | 0 | 2,630 | 2,170 | 5,200 | 4,101 | Child 6–19 | −1,224 | 0 | 18,877 | 21,507 | 26,707 |
| 20,000 | 0 | 1,670 | 170 | 3,800 | 3,261 | Child 1–6 | −1,530 | 0 | 21,731 | 23,401 | 27,201 |
| 24,000 | 0 | 710 | 0 | 2,400 | 2,421 | Child 1–6 | −1,836 | −190 | 24,395 | 25,105 | 27,505 |
|
|
|||||||||||
Level of Benefits and Impacts on Work Incentives
How much do the above safety-net programs pay in benefits? Table 1 presents the benefit levels provided to a qualifying family whose annual earnings equal the amounts listed in the first column of the table. Calculations in this table assume that the family includes a father, a mother, and two children below the age of eighteen, and that this family lives in California.1 According to the row in the table for a family that earns $8,000 a year, this family would be eligible to receive $5,498 from TANF, $4,550 from food stamps, $6,170 from SSI, $8,000 in housing benefits from the Section 8 program, and $3,200 from EITC, for a total of $27,418 in government assistance. Moreover, this family would qualify for Medicaid’s Medically Needy Program (MNP), wherein all family members would receive zero-price health care. On reaching $16,000 in earnings, the family would qualify for Medicaid’s Children Ages 6 to 19 Program (Child 6–19), which provides zero-price health care to all children in the family; and at $20,000 in earnings, the family would qualify for Medicaid’s Children Ages 1 to 6 Program (Child 1–6), which offers zero-price health care to all children ages six and below.
To determine the disposable income available to a family, one needs to add the family’s earnings and the payments it receives in program benefits and then subtract the amounts paid in taxes. Any family faces three categories of taxes: Social Security payroll taxes, federal income tax, and state income tax. The eighth and ninth columns of the table show the amounts a family of four must pay in payroll and federal income taxes for the various levels of earnings—the negative values in these columns indicate payments that subtract from income rather than add to income. The table does not include a column for state taxes because none are paid for any of the income values considered in the table. The last three columns of the table report a family’s disposable income for each level of earnings, assuming participation in the programs listed in the associated column. The family that earns $8,000 receives $10,588 in disposable income for the year when it chooses not to participate in any welfare program and obtains benefits only from EITC. This family’s disposable income grows to $19,317 if it decides to take TANF and food stamps and to $25,393 if it also chooses to obtain assistance for rent.2
Note, by looking at the “Taxes, EITC, TANF, FSP” column, that a family participating in these programs increases its disposable income by $5,294 when it raises its earnings from zero to $4,000. That means that, in this range of earnings, work is rewarded; the family actually increases its disposable income by more than $4,000. But if a family raises its earnings from $12,000 to $16,000, its government benefits fall so much that its disposable income literally declines by $124. This happens because program benefits fall as earnings rise. Families facing these latter circumstances (earning $12,000) clearly have no incentive to increase their work effort since they will see no enhancement of their spending power. If one alters the family’s situation and also has it participate in housing programs, then the last column shows that raising earning from $12,000 to $24,000 yields merely $498 more in disposable income. Such features of our welfare system sharply reduce the returns of work, and in doing so discourage families from increasing their work activities. The U.S. welfare system enhances work incentives at low levels of earnings, but discourages work thereafter. To counterbalance such work disincentives, welfare reform in the mid-1990s introduced work requirements that required families to work above specific thresholds in order to qualify for benefits.
Future Directions
Welfare reform was enacted to promote self-sufficiency and to improve flexibility in the design of income-maintenance programs. To a large extent, these goals have been achieved. TANF has brought about substantial increases in the work activities of low-income families and enhanced states’ flexibility to create welfare systems unique to their constituencies. States are using the monies they are allocated in a more efficient manner—focusing on job readiness, child care, education, and work placement.
What other policy trends characterize the evolution of welfare system in the United State today? Briefly, two key forces are changing the basic relationship between the government and welfare recipients in all programs.
First, welfare programs at all levels are being geared toward more work-related activities. Nearly every program gives priority to parents who show a willingness and commitment to work. At the same time, able-bodied adults who refuse to work now find themselves disqualified from many programs. The emphasis on work has gained strength only since 1996. Proposals for the reauthorization of welfare reform all generally push for stricter work requirements and a longer work week.
Second, there has been a movement from pure in-kind provision to voucher-based systems. In-kind provision represents government efforts to both fund and directly serve the poor. Voucher systems are being emphasized not only for shelter but also for provision of food, health care, job training, and child care, among others. A cash-equivalent voucher is provided directly to the person served, who then redeems the voucher at any qualified/authorized service provider. This approach brings some of the advantages of market-based economics to the provision of welfare. The recipient spends dollars on the things he or she wants most. A classic example is public housing. HUD provides the funding for most public housing, and local government housing authorities use it to buy or build publicly owned residential units. This inefficient use of funds segregates low-income families into common facilities that typically duplicate housing resources that are widely available in the private market. Over the past decade, HUD and other government providers have been opting to fund more voucher-based, Section 8-type housing to meet the needs of the poor, thus allowing recipients greater choice in where they live.
Although welfare reform has achieved success in a short amount of time, more reform is needed. Of the many government assistance programs, only one, TANF, has seen any significant reform. The remaining programs (food stamps, SSI, housing assistance, Medicaid, and EITC) are about as inflexible as ever and generally ignore what is going on in the rest of the system. Future policy initiatives are likely to alter these programs toward the direction set for TANF in the 1990s welfare reform, with the two above trends continuing to influence new reforms.
Does Welfare Help the Poor?
David Henderson
Economists believe that people tend to make decisions that benefit themselves, so the answer to the above question seems obvious. If welfare did not help the poor, then why would so many of them go on welfare? This self-interest among the poor could also explain a phenomenon noted by those who study welfare, namely that only about one-half to two-thirds of those who qualify for welfare programs are enrolled in them. Presumably, the others have decided that it is in their self-interest to refuse the money and keep the government from meddling in their lives.
So, while it seems clear that welfare helps the poor who accept welfare, that does not mean that welfare helps the poor generally. Two groups of poor people, not counted in the welfare statistics, are hurt by welfare. The first group consists of the future poor. Economists know that welfare is a disincentive to work, and, therefore, that its existence reduces an economy’s output. If even some of this output would have been used for research and development, and if this forgone R&D would have increased growth, then welfare hurts growth by reducing R&D. If the annual growth rate of GDP in the United States had been just one percentage point lower between 1885 and 2005, then the United States today would be no richer than Mexico. The main thing that helps all poor people in the long run is economic growth. Even though the 1920s are thought of as a decade of prosperity, by today’s standards almost all Americans in the 1920s were poor. Economic growth made almost all Americans richer than their counterparts of the 1920s. A reduction in economic growth, even a slight one, if compounded, causes more future poverty than would otherwise have been the case.
The second group hurt by U.S. welfare is poor foreigners. The welfare state acts as a magnet for poor immigrants to the United States. Because of this, there are various domestic pressures to limit immigration. Without the welfare state, the number of immigrants would likely rise substantially, meaning that many previously poor foreigners would become much richer. The welfare state limits this improvement.
Based on Tyler Cowen, “Does the Welfare State Help the Poor?” Social Philosophy and Policy 19, no.1 (2002) pp. 36–54.
Further Reading
Footnotes
To qualify for low-income assistance, the family must have less than two thousand dollars in financial and housing assets. For the calculation of housing benefits, Table 1 assumes that the family pays nine hundred dollars in rent per month. In some circumstances, eligible benefit levels may be affected by dual-enrollment restrictions (e.g., cannot receive TANF and SSI concurrently).
In the calculation of food stamps and housing benefits, payments from TANF count as income: this lowers payments below the amounts listed in the table for the program. The program benefits listed in the first set of columns assume that the family participates only in that particular program.