Categories:
Labor Market
Macroeconomics
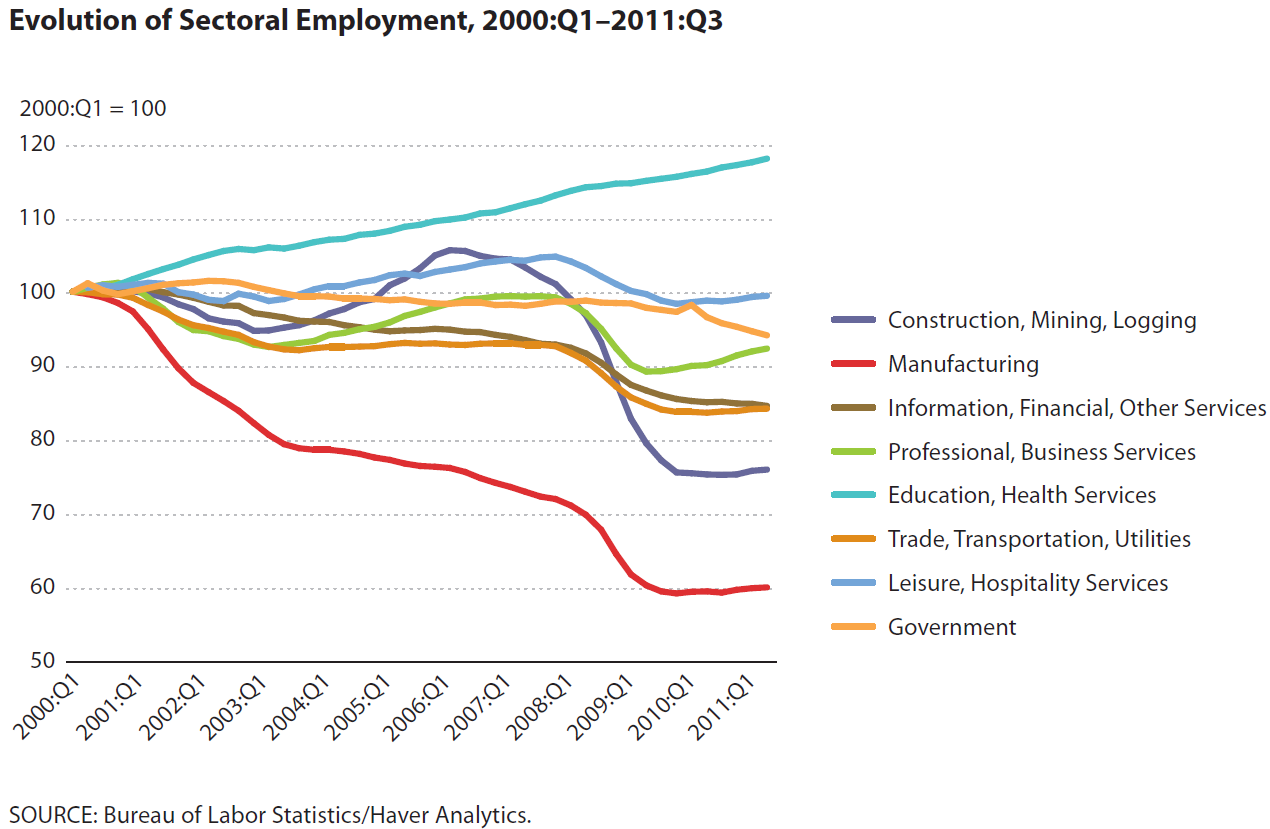
A reader who remembers this essay suggested this chart:
I lifted the chart from Barry Ritholtz, who in turn lifted it from paper by David Andolfatto and Marcela M. Williams.
I think that the evidence for structural change as a factor in this recession is there for those who are willing to see it.
READER COMMENTS
Karl Smith
Mar 13 2012 at 5:15pm
Not completely sure what you mean by is a factor, but the only curve whose basic trajectory was altered was construction.
Otherwise things have the same basic trend they had all along and are trend reverting.
Even look at the red line. Draw a trend from 2000 to now. You can see that manufacturing overshot its trend and now it is growing much faster than normal which is to say its not declining at nearly its trend rate.
Chris Koresko
Mar 13 2012 at 5:57pm
After staring at this plot a bit, I see the various curves as falling into three categories defined by their behavior with respect to their 10-year trend:
Most of the curves inflect upward in early 2003, downward in 2008, and upward in 2009, with no large change in slope around 2006. These include Manufacturing, Information, Trade, Professional, and Leisure. Call these the “real economy” (not Government-driven) curves.
Construction follows a similar trend, except that it inflect strongly downward in 2006.
Government and especially Education/Health are very stable with respect to their trend lines.
What does this mean?
Construction peaked in 2006 and began a decline. It is the only curve to do that. It inflects downward with the other real-economy curves in 2008. This behavior is consistent with a picture in which the collapse of a “housing bubble” in 2006 triggered the subsequent downward inflections in the real economy.
It is interesting that the Government line doesn’t inflect upward around 2010 as the Stimulus spending and the large growth of the Federal government kicked in. That suggests the spending increases may have been largely transfer payments out of the Government area rather than increased production of Government itself.
Philo
Mar 13 2012 at 11:15pm
Structural change is always taking place, in booms and middling periods as well as in recessions.
Ghost of Christmas Past
Mar 14 2012 at 2:01am
I think the “education” numbers should be disentangled from those for “health services” and consolidated with the “government” numbers to produce two replacement lines on the chart, one for “government and education” and the other for “health services.” So far as I can tell, nearly all the growth in “education” is really growth in government spending on education (I consider all the post-secondary “guaranteed student loan” programs tantamount to government spending).
Why would anyone conflate the education and health-care sectors anyway, unless they were grinding some leftist axe? Among other reasons to reckon them separately, utilization of health care technology is growing while utilization of education technology is stalled, and health care demand is proportional more to the numbers of the aged while demand for education is more proportional to the numbers of the young.
Scott Sumner
Mar 14 2012 at 12:06pm
That’s roughly how I’d expect things to look if structural change was gradually occurring, but was not a factor in the recession.
Comments are closed.