I often see Fed officials claiming that the fall in unemployment means that they need to raise interest rates. Sometimes this is based on “Phillips Curve” thinking—the (false) idea that inflation is caused by a booming economy. In fact, the relationship between economic growth and inflation depends on the nature of the shock hitting the economy. A positive supply shock causes growth and lower inflation, while a positive demand shock causes growth and higher inflation. Only in the latter case does growth require the Fed to raise interest rates.
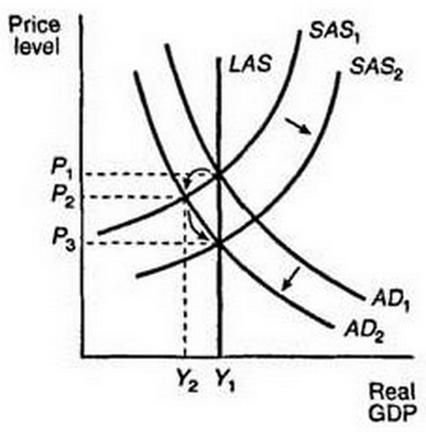
Consider the following AS/AD diagram, right out of EC101:
Between 2007 and 2009, the AD curve shifted to the left. Output and inflation both fell. Since 2009, the SRAS curve has been gradually shifting to the right, as wage growth moderated from its normal 3.5% to about 2%/year. Notice that this sort of growth is not inflationary.
That doesn’t mean that the Fed should not raise rates this year, it does have a dual mandate. However it should not pay much attention to the unemployment rate, but rather should focus on variables like NGDP growth and wage growth. Early in the year there was some indication that wage growth was accelerating. But that no longer seems to be the case, and the latest figures show exactly 2.0% hourly wage growth over the past 12 months. That’s the same rate as we’ve been seeing for the past 6 years, and is too low for the Fed to hit its 2% inflation target. There is no justification for raising interest rates when hourly nominal wage growth is below 2.3% on a 12-month basis. None.
Sub-2% price inflation during a period of low unemployment could be justified on “dual mandate” grounds, where the Fed would then run inflation above 2% during high unemployment periods. In fact, the Fed has tended to do the opposite in recent decades, running inflation lower during recessions than booms. And they still have not changed their (interest rate) operating procedures to address this problem. Inflation is very likely to fall during the next recession, just as in the past few recessions. If we go into the next recession with 1.5% inflation, and then it falls further, then the Fed will lose credibility. Fed officials need to think very hard about their long run strategy to hit 2% inflation. Right now I don’t see a plan, other than Fed officials crossing their fingers.
Back in 2011 the Swedish Riksbank temporarily ignored its 2% inflation mandate to fight asset bubbles. That tight money policy pushed Sweden into deflation, and they had to reverse course. Today they cut rates again, to minus 0.375%, in an attempt to get inflation back up to target. Nick Rowe has a recent post that explains how “a stitch in time can save nine.” If the Fed isn’t careful it might end up repeating the mistakes of the Riksbank (and ECB in 2011, and BOJ in 2000 and 2006.)
READER COMMENTS
JG
Jul 2 2015 at 2:41pm
I have said so many times that if the fed hikes early, they may end up having to keep rates low for more time, not less, as they artificially stem growth.
AlexR
Jul 2 2015 at 4:14pm
Scott, I wouldn’t ask the following question if I didn’t think that many microeconomists, those who are disillusioned with macro generally, hold similar questions.
What on earth is a “positive demand shock,” in the context of a rightward shift in the “long run aggregate demand curve” in your graph?
It seems easy enough to conjure up examples of “positive supply shocks” (rightward shifts in the “long run aggregate supply curve”). There can be technological improvements that lower marginal costs for many goods, or easings in inefficient regulation that have similar stimulative effects.
There is also a plausible story told in undergrad (and grad) classes for a shift in the “short run aggregate demand curve”: the fiat money stock unexpectedly rises, leading consumers to temporarily think they’re richer in real terms.
But can you provide an example of a rightward shift in the “long run aggregate demand curve”? An example in which (1) consumers are rational and forward-looking, and (2) the factors driving the shift differ from those that drive shifts in the “long run aggregate supply curve”?
Rajat
Jul 2 2015 at 5:28pm
How do you reconcile a rightward shift in the SRAS curve with a falling participation rate? Is the SRAS perhaps shifting right but getting steeper at higher levels of output?
Scott Sumner
Jul 2 2015 at 10:38pm
JG, That’s right.
Alex, I’m afraid I don’t understand the question. I’m not aware of any distinction between short and long run AD curves. There’s just one AD curve in all the models I have seen. It’s on the supply side where the short and long run distinction matters.
Rajat, That simply slows the rate at which SRAS shifts to the right. But it still shifts right. We’ve still been gaining 2 to 3 million jobs per year.
Comments are closed.