Here is Arnold Kling:
What I wish to point out is that the relationship as depicted is an anomaly with respect to textbook AS-AD, including both Keynesian economics and Sumnernomics. Timothy Taylor refers to the relationship as a Phillips Curve. However, the Phillips Curve relates nominal wages to unemployment, and the chart shows real wages and unemployment. Although in standard macro nominal wages may rise as the unemployment rate falls, real wages are supposed to move in the opposite direction. In standard macro, aggregate supply is derived from movement along the demand curve for labor. When real wages rise by less than productivity increases, demand for labor rises and output goes up. When real wages rise by more than productivity increases, demand for labor falls and output goes down.
Let me start by pointing out that the graph Arnold is referring to does not show the cyclical behavior of real wages. For instance, in the graph real wages decline in 2009, whereas in fact real wages shot upward in 2009. I’m not sure what it does show, but it’s not real wage cyclicality. But I’m more concerned with his reference to “Sumnernomics” which presumably refers to my “Musical Chairs model” of wages and the business cycle. Let me be very clear:
REAL WAGES PLAY NO ROLE IN THE MUSICAL CHAIRS MODEL.
I repeatedly emphasize that inflation is an almost meaningless variable, and hence real wages are equally meaningless.
I also encourage people to “never reason from a price change”, which means don’t assume the labor market is impacted by shifts in labor supply, or labor demand. Either is possible.
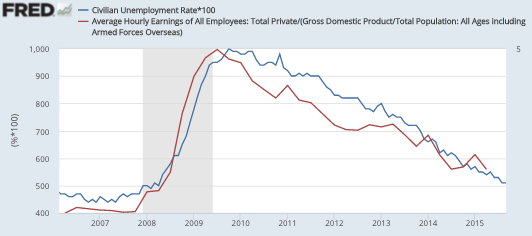
In fact, recent history is strongly supportive of “Sumnernomics”, which predicts a positive correlation between Wages/NGDP Wage/NGDP and unemployment:
And if you take a longer view the model still does quite well:
Some people claim my model is almost like a tautology. I’ll take that as a compliment.
PS. I forgot who sent me the second graph. If you send me your name I’ll add it to the post.
PPS. I did use real wages in my Great Depression study (done in the 1990s), but emphasized that this was only because I lacked reliable high frequency NGDP data. And I also pointed out in the study that it was an ad hoc model, which applied only to the special circumstances of the interwar period—when the shocks hitting the economy happened to lead to countercyclical real wages. In addition, the price index I relied upon (the WPI) was probably more closely correlated to NGDP than it was to the CPI during the interwar period.
READER COMMENTS
Arnold Kling
Nov 4 2015 at 9:40am
Let W be the nominal wage, P be the price level, L be total employment, and Y be real output. Then you say that unemployment is correlated with WL/PY.
a) I see a real wage there. It is divided by Y/L, which is productivity. Another term for this is unit labor cost.
b) Saying that unemployment rises as unit labor cost rises is not a tautology. It is the standard 1970 model of employment and unemployment.
Nick Rowe
Nov 4 2015 at 11:46am
If we assume:
1.nominal wages are sticky, but prices are perfectly flexible.
2. Diminishing MP of labour (with land and capital fully employed)
3. Perfect competition
Then we get the standard inverse relation where W/P rises in recessions.
Drop one (or more) of those assumptions, and we don’t.
Scott Sumner
Nov 4 2015 at 12:09pm
Arnold, No, I don’t say unemployment is correlated with WL/PY, I say it’s correlated with W/PY. And I don’t see a real wage there, at least not the real wage used in the study that you said somehow conflicts with “Sumnernomics.” Yes, you can call W/PY a real wage if you want, but then that’s the real wage you should use in your empirical test. Check out my graphs above.
You said:
“Saying that unemployment rises as unit labor cost rises is not a tautology. It is the standard 1970 model of employment and unemployment.”
That’s not at all what I’m claiming, I think you need to take another look at my “musical chairs model”, it’s clear to me that you’ve misinterpreted it. I’m saying unemployment usually rises when W/NGDP rises (of course the correlation is not perfect.)
Nick, What if the demand for labor shifts? An oil shock dramatically raises the price level and reduces the demand for labor. Employment and real wages both fall. Doesn’t that meet all three of your assumptions?
Scott Sumner
Nov 4 2015 at 12:14pm
Arnold, It just occurred to me that my “Wages/NGDP” ratio may have confused you. I meant hourly wages over NGDP, not total wage income, hence I just changed it to “Wage/NGDP”.
Nick Rowe
Nov 4 2015 at 1:16pm
Scott: Ah, yes! I was implicitly assuming a pure demand-side shock.
fralupo
Nov 4 2015 at 3:20pm
I’m trying to understand the charts. The ratio is roughly full-employment wages / NGDP, right? It seems to me that the relationship with unemployment implies that nominal wages are constant while NGDP shifts around with the number of employed people. Am I interpreting this correctly?
marcus nunes
Nov 4 2015 at 4:52pm
A view of the Musical Chair Model
https://thefaintofheart.wordpress.com/2013/01/28/another-take-on-the-game-of-musical-chairs-view-of-business-cycle/
Scott Sumner
Nov 4 2015 at 8:42pm
Fralupo, Yes, nominal wages change slowly over time (although they are not constant), the big shocks are to NGDP.
Thanks Marcus.
Andrew_FL
Nov 4 2015 at 11:08pm
I had to interpolate a bit to get NGDP to the same time resolution as FRED series AHETPI but I got this.
The red curve is the unemployment rate, the blue curve is percent deviation of AHETPI/NGDP from an HP trend (lambda = 10000000 and yes it does need to be about that large) it does certainly look like it explains much of the medium term variability in the unemployment rate.
Scott Sumner
Nov 6 2015 at 10:52am
Thanks Andrew.
Saturos
Nov 7 2015 at 1:16pm
[Comment removed pending confirmation of email address. Email the webmaster@econlib.org to request restoring this comment. A valid email address is required to post comments on EconLog and EconTalk.–Econlib Ed.]
Comments are closed.