
Two recent, related COVID news items:
- The U.S. death toll from COVID passed 750,000 earlier this month, according to both the National Center for Health Statistics and Johns Hopkins University. JHU further estimates that world COVID deaths have topped 5 million.
- A new Kaiser Family Foundation poll indicates that nearly two-thirds of Americans either believe “the government is exaggerating the number of COVID deaths” (38%) or at least they don’t know it’s not exaggerating (22%).
History provides plenty of reasons to be skeptical of government pronouncements. But in this case, I believe the U.S. COVID death numbers are either spot-on or underestimate the count. I’ll explain why below.
But before doing so, let’s take a moment to consider some of the reasons people give for why they don’t accept the COVID numbers. I’ve encountered some who believe that authorities are outright fabricating the death count. Others, however, believe the numbers are inflated because of various classification errors:
- Some people who were not infected with COVID, but who died of causes like influenza & pneumonia and chronic lower respiratory disease that have similar symptoms to COVID, are being wrongly attributed to COVID.
- Some people who were infected by COVID but died of other causes are being wrongly attributed to COVID.
- For some people, COVID may have been the immediate cause of death, but these people were in deteriorating health already, so COVID isn’t really increasing the national death toll as much as the numbers suggest.
Those explanations aren’t unreasonable, but I don’t think any of them are distorting the NCHS and JHU numbers. My evidence for this comes from a fascinating, if macabre, series of publications: the Centers for Disease Control’s annual Morbidity in the United States reports. Those, in turn, aggregate data from the CDC’s Morbidity and Mortality Weekly Reports, which are generated using death certificate information submitted by state health departments.
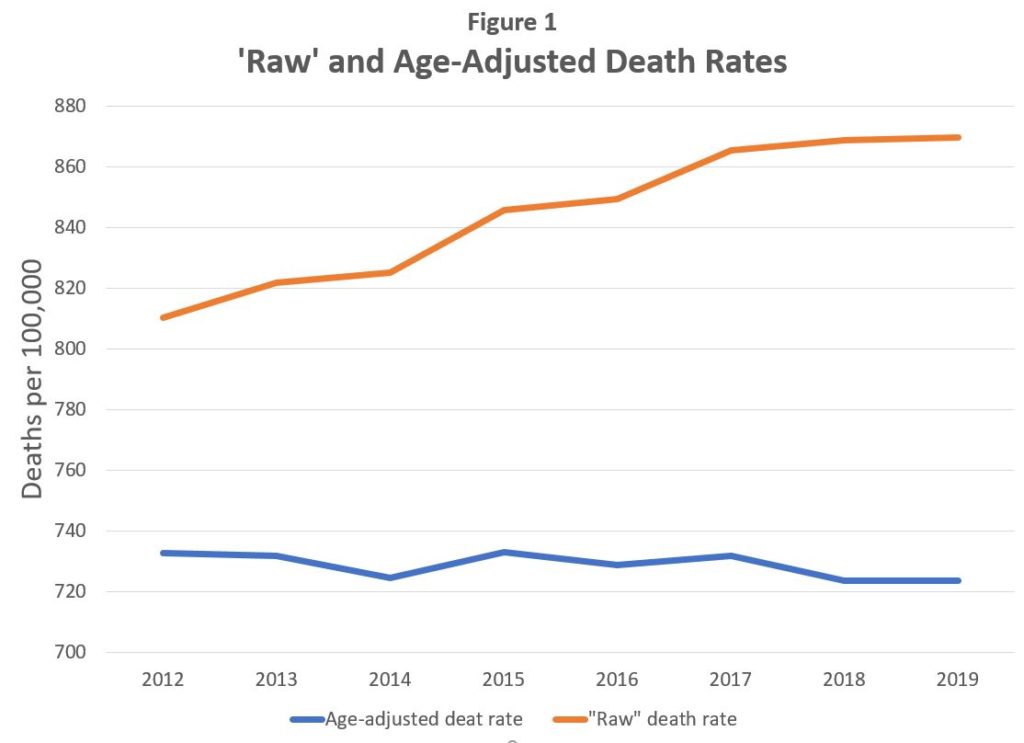
The reports provide snapshots in time of what kills Americans. In recent years, year-end and year-out—until 2020—around 0.85% of U.S. residents died each year. To be more accurate, over the years 2012–2019, the percentage of Americans dying each year grew from 0.81% to 0.87%.
This increase is attributable to the aging of the American population, with the median age growing by one year over the eight-year time span. Because many causes of death correlate with aging, an older America means a slightly higher percentage of Americans die each year. For that reason, the CDC reports include age-adjusted data for comparing death rates over different years (and different diseases and geographic areas). Figure 1 presents both the “raw” and age-adjusted death rates for the United States for 2012–2019. Notice that as the raw rate increases from 810.3 to 869.5 deaths per 100,000 people per year, the trend for the age-adjusted rate is basically flat, varying between 723.6 and 741.3.
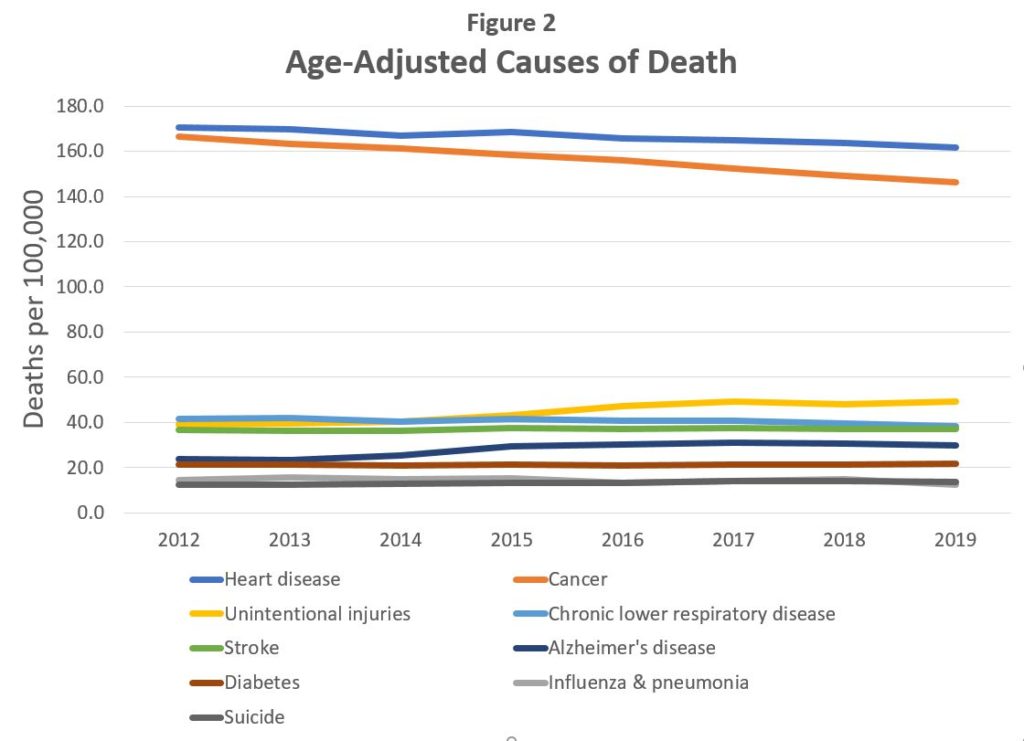
Not only does the age-adjusted death rate hold steady over this time frame, but so do the rates for most of the top 10 causes of death. These are graphed in Figure 2. The top two killers by far are heart disease and cancer, combining for nearly half of all U.S. deaths. (A bit of good news: notice that both are trending downward, indicating some success in combating these killers.) Significantly below them are deaths from unintentional injuries, chronic lower respiratory disease, stroke, Alzheimer’s disease, diabetes, influenza & pneumonia, kidney disease, and suicide. (And a bit of bad news: notice the upward trends in unintentional injury and Alzheimer’s deaths.)
But things changed in 2020. Total deaths jumped from 2,854,838 in 2019 to 3,358,814, according to provisional CDC data. The raw death rate for 2020 rose by 17.7% (while previous years ranged from 0.6% to 3.3%), from 869.5 to 1,019.4 per 100,000. The age-adjusted rate increased 15.5%, from 723.6 to 835.4. A new cause of death had become the nation’s #3 killer, with an age-adjusted death rate of 85.0: COVID. See Figure 3.
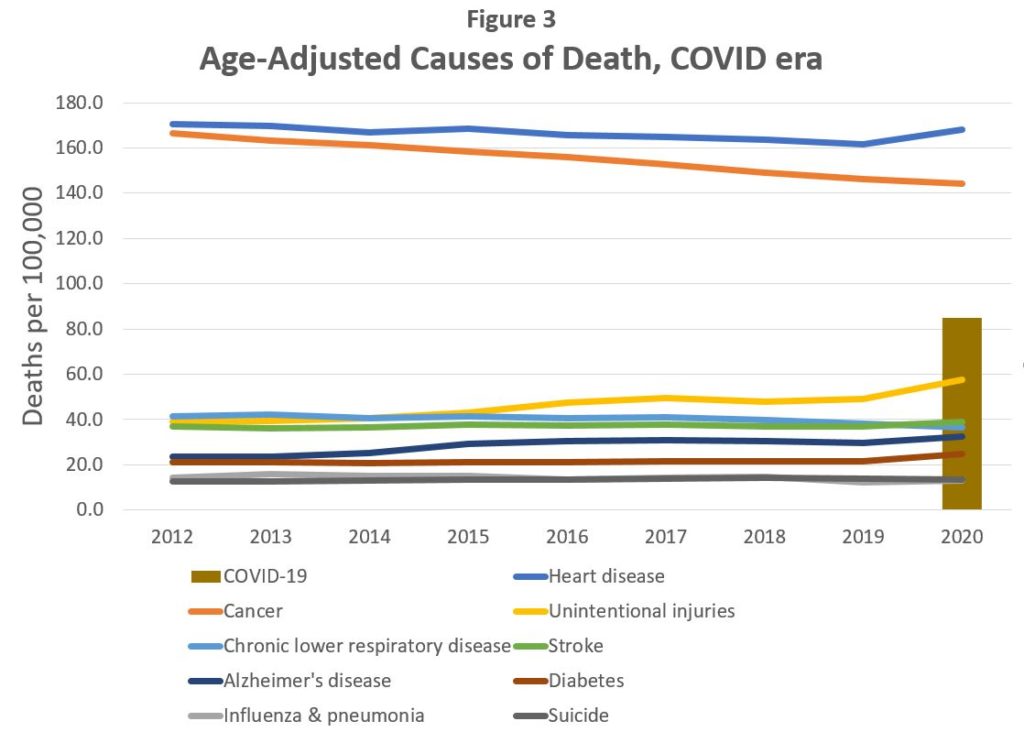
Meanwhile, the top-10 causes of death over 2012–2019 basically continued along their long-term trends. There’s no indication that deaths from influenza & pneumonia and chronic lower respiratory disease were being wrongly included in the COVID 19 deaths: the age-adjusted death rate from flu & pneumonia increased from 12.3 to 13.1 (despite all of the social distancing, sanitizer use, and mask-wearing), while the rate for chronic lower respiratory disease fell only from 38.2 to 36.4. No other causes of death experienced significant declines.
Moreover, though COVID’s dead were predominantly aged, it doesn’t appear that much of that death toll can be dismissed as simply depriving a few weeks of life from already-deteriorating victims. Again, half-a-million-plus more people died in 2020 than 2019.
Something else worth noting: As previously said, a half-million more people died in 2020 than 2019, but the CDC attributes only 345,323 of those deaths to COVID. It’s possible that future analyses will indicate that another 50,000 to 100,000 deaths should be added to that count.
And the grim beat has continued in 2021. In the first quarter of this year, the total age-adjusted death rate rose to 898.7 per 100,000 and the age-adjusted rate for COVID increased to 149.6, again according to provisional CDC data. This was before the more transmissible delta variant became dominant in the United States. An additional 400,000+ COVID deaths so far in 2021 seems likely, if not low.
So, I doubt the grim government death statistics for COVID are exaggerated; if anything, they’re optimistic.
Thomas A. Firey is a Cato Institute senior fellow and managing editor of Cato’s policy journal Regulation
READER COMMENTS
steve
Nov 23 2021 at 4:37pm
I think your math is pretty good. Just so you know we have been actively testing for flu and RSV. We always did that for kids but we have also been doing that for the flu and RSV as part of our covid tests for quite a while. We had one pediatric flu death in the 2020-2021 season compared with 195 the year before. 646 adult flu deaths in 2020-2021 vs 24,000-62,000 the year before. We had not always tested for flu in the past and diagnosed based upon symptoms/time of the year but we now actually test. Since flu deaths were down so much but pneumonia/flu as a category was stable that suggests a big increase in pneumonia.
https://hive.rochesterregional.org/2020/01/flu-season-2020
Michael Rulle
Nov 24 2021 at 5:20pm
https://www.cdc.gov/nchs/nvss/vsrr/covid19/index.htm
Hi Steve
The above shows the CDC’s count of Covid 19, pneumonia, and flu deaths since 1/1/20 It is clear the counting method has changed—–and hopefully someone can explain why. Covid: 796,000; Pneumonia: 695,000; Flu: 9,500. From May 2020 Flu deaths were 1500.
The total of all deaths from either of the 3 is 1,095,000 since 1/1/20.
Flu and pneumonia are radically different than in previous years (flu about 5% or less than in prior years–, Pneumonia–, 7-8 times more than prior years) .
If the flu numbers are correct we have overcounted in prior years by an enormous amount. If the Pneumonia numbers are correct we have massively undercounted in prior years.
The footnotes state that flu deaths include those with Covid or Pneumonia.
Pneumonia deaths exclude those with Flu.
And Covid and Pneumonia both include the deceased if they also had the other disease—hence their combination has 399,000 people who appear in both categories—that is, the number who died having both diseases–(and also other diseases which are not identified).
So collectively, while we discuss what Covid deaths “really are”—-we ignore that we completely changed history—-and what past deaths “really were”–at least regarding Flu and Pneumonia
I think this is a problem of great magnitude.
steve
Nov 25 2021 at 11:34am
These are relatively new stats the CDC provides because of Covid prevalence. It does get hard to sort out but that has always been true. Many if not most flu deaths, just to give an example are actually due to bacterial superinfections. But if you use the traditional measurements not this new one you are citing flu deaths are even lower.
Steve
Michael Rulle
Nov 25 2021 at 12:02pm
What am I missing. Do we really believe we are counting flu and Pneumonia the same as we have historically? I would love to know the answer.
Michael
Nov 28 2021 at 7:23am
Yes, we are counting them the same – these are standard reporting systems the CDC has had in place for decades. Explanation:
Most of the measures taken to reduce the spread of Covid are non-specific measures that are effective against any infections respiratory disease. You can’t get Covid or the flu without interacting with someone with Covid or the flu. School and business closures, working from home, social distancing, wearing of masks. Whether or not these measures are good or bad in a big picture sense, they do reduce the spread of Covid… and flu. In fact, because Covid (even the original variant, but especially the delta variant) id far more infectious than the flu, measures that are effective against Covid are even more effective against flu. Flu deaths crashed because of the public health measures taken to reduce the spread of Covid.
The exceptions to this are the specific measures that slow the spread of Covid: Covid testing regimens and vaccination would have no affect on the spread of the flu.
Pneumonia is a bit more complicated, in that “Covid-related pneumonia” is the way that people die of Covid. My guess is that some death certificates that list Covid as a cause of death also list pneumonia and others do not. But I don’t understand the reporting systems well enough to understand why. (It is not at all unusual for multiple causes of death to be listed on death certificates. Fatal long-term complications of diabetes include, among other things, heart attacks, strokes, and kidney failure. But these complications are not unique to people with diabetes. A person without diabetes who dies of a heart attack will have heart attack listed as the cause of death. A person with diabetes who dies of a heart attack will most likely also have heart attack listed as a cause of death, but may or may not also have diabetes listed as a contributing cause. These reporting systems are ultimately based on what physicians list on death certificates and so there are some inconsistencies.)
Eric Hanneken
Nov 23 2021 at 9:12pm
I’m not so sure the extra deaths in 2020 will all eventually be attributed to COVID. Would-be patients were more reluctant to, or found it more difficult to, visit physicians in 2020. Non-COVID illnesses that would have been diagnosed or treated a year earlier, weren’t.
Michael
Nov 24 2021 at 6:43am
This is plausible (virtually certain to be an issue to some degree), though I doubt it is aenough of an issue to detract from the author’s main conclusion – that Covid-19 deaths are undercounted.
Looking at the graph with 2020 data, we see upticks in deaths from unintentional injuries, stroke, diabetes, and heart disease. It is pretty reasonable to expect that some of the unaccounted for deaths are caused by those. But Covid-19 remains the elephant in the room – it remains likely that Covid is also a cause of a lot of unaccounted for deaths.
I think researchers should be able to figure out some of these details in the coming years, by looking at where (within the US) and when the deaths occurred. That can be compared to local/regional policies that might be expected to affect access to medical care (e.g. lockdowns) and also to hospital overcapacity.
Mark Brophy
Nov 25 2021 at 1:20pm
That won’t work because the entire country was locked down for 2 months. If a few states had been as open as Sweden, we’d have good data.
Michael
Nov 25 2021 at 6:36pm
That’s not a problem. Even in the 2 months you refer to, the presence and severity of the Covid wave varied regonally within the US. Any deaths driven by policy rather than Covid would be expected to be consistent accross the country, while deaths driven by Covid would be concenterated at the epicenters of the first wave. Later, once policies stated to vary regionally, there is even more ability to differentate between Covid effects and policy effects.
Rob Rawlings
Nov 23 2021 at 9:22pm
Great article !
It addressed many of the questions I had about Covid stats for the US but for which I had been unable to find good answers.
Thomas Lee Hutcheson
Nov 24 2021 at 7:05am
“History provides plenty of reasons to be skeptical of government pronouncements.”
This is gratuitous. The supposed “reasons” do not apply to government-provided data.
Pierre Lemieux
Nov 26 2021 at 10:42am
Thomas: History is not only American history. “Pronouncements” is not synonymous with data, although it includes political interpretations of data.
Christophe Biocca
Nov 24 2021 at 8:19am
In the UK, the definition of a COVID death is any death less than 28 days after a positive COVID test. It’s not particularly difficult to do the math for how many “COVID deaths” you’d still get in that country if COVID was perfectly non-lethal.
For example, today’s number of cases is 42,482. At the lowest-ever background death rate in the UK (8.7 per 1000, back in 2011), we should expect 28.3 deaths for non-COVID reasons over the next 28 days. That’s about 20% of “COVID deaths” being background deaths for reasons unrelated to the virus.
This wasn’t a noticeable problem when COVID’s IFR was higher, but with increasing vaccinations and prior infections, this counting method is running into serious measurement noise. It will get even worse if the new antivirals are as effective as the trials show (89% reduction in mortality) and widely adopted, to the point that 2/3rds of reported “COVID deaths” would have happened regardless.
DeservingPorcupine
Nov 24 2021 at 11:03am
Disagree strongly, not because I’m a conspiracist or think that the covid death toll is radically exaggerated, but the fact is that there was explicit financial incentive from the government for covid deaths. If we pay for deaths to be covid, our prior should be that they will be exaggerated somewhat.
Lots of extra overdose deaths and murders last year. Traffic deaths were also up.
Michael
Nov 25 2021 at 7:05am
I think the evidence presented here weighs against your claim. I think your argument is “There was explicit financial incentive from the government for covid deaths, thus Covid deaths were overreported.” But a key focus of this article is on what appears to be the underreporting of Covid deaths. The total number of deaths is much higher than the reported number of Covid deaths. Under your argument, those excess deaths are the equivalent of $20 bills left on the sidewalk, not picked up by the healthcare providers and other institutions who were given an opportunity to access additional revenue by overreporting Covid deaths.
DeservingPorcupine
Nov 26 2021 at 1:29pm
No, it just means there are limits to what deaths people can reasonably classify as a covid death.
What is the proposed mechanism by which the US would undercount covid deaths? Do you think there is any chance at all, except at the very beginning of the pandemic, that a person gets hospitalized with signs of an upper respiratory infection and doesn’t get repeatedly tested for covid? Heck, do you think there’s any chance that anybody, regardless of symptoms, gets admitted to a hospital without getting tested for covid?
All that this analysis shows is that there are unclassified deaths. The notion that these are very likely to have predominately been actually caused by the one thing we’ve been handsomely paying people to classify them as, if at all possible, strains credulity.
Michael
Nov 26 2021 at 4:54pm
Two obvious ones: 1) hopsital overcorwding leading to people dieing at home without being tested, and 2) early on, when testing capcity was very limited, not everyone with Covid received a cofirmatory test.
Your allegations are merely that – allegations unsuported by any evidence whatsoever. It is consistent with your worldview that Covid cases and deaths have been overreported, so you accept it on faith.
DeservingPorcupine
Nov 27 2021 at 4:18pm
I don’t see how your claims are any less speculative than mine, but mine are backed by the sound priors that we accept everywhere else, that incentives matter.
Again, all we have are uncategorized deaths here. It seems crazy to assume they were caused by the thing we were most incentivized to name as the cause instead of something that nobody was paid for finding.
Brandon Bergl
Nov 24 2021 at 11:25am
Why are unintentional injuries increasing so rapidly? Does that include drug overdoses?
Don Boudreaux
Nov 24 2021 at 1:30pm
Tom:
Your analysis here is solid and important. Thanks for doing it. (While I still have some lingering worry about possible distortions introduced into the data by the point raised by commenter DeservingPorcupine, your analysis significantly weakens my suspicion that the premium paid to hospitals for each Medicare patient listed as having Covid creates a serious overcounting of Covid deaths.)
But I want to warn against a possible, although unintentional, misimpression created when you write that
“Predominantly” is an understatement. A more-accurate descriptor is “overwhelmingly.” According the latest CDC data, more than half – 52 percent – of Covid deaths in the U.S. are of people 75 years and older, with 27 percent of Covid deaths being of people 85 years and older.
Seventy-five percent of Covid deaths in America are of people retirement age (65) and older.
On the other side, only 7 percent of Covid deaths are of people below the age of 50.
Also, the argument made by those of us who insist on the relevance of the undeniable and very steep age gradient of Covid’s serious health consequences does not rest on any claim that most Covid deaths are of people whose remaining life expectancies were only a few weeks. For example, the typical 85-year-old in the U.S. can expect to live about another six or seven years. And so while Covid is more likely to kill an 85-year-old who is unusually ill for his or her age (than to kill a healthier 85-year-old), it’s still unlikely that the typical elderly person killed by Covid had only a few weeks of life remaining. That person likely had several months or even a few years of life remaining.
Covid is real and it really kills. And such a loss of life is, of course, unfortunate. Yet two related realities loom that too many people ignored since early 2020.
The first of these realities is that a disease that overwhelmingly reserves most of its dangers for the elderly should be recognized as such, especially by policymakers and people in the media. But this reality was played down and even ignored, while others who acknowledged this reality denied its relevance. Even now many people act – and seem to believe – that Covid’s risks are general. The mania for closing schools, masking children, and mandating vaccination very much reflect, I think, the public’s continuing failure to understand that Covid poses little risk to the bulk of the population, and virtually no risk at all to children and young adults.
The fact that the typical elderly person killed by Covid had, at the time of his or her death, an expected life span of more than a few weeks is true enough, but it doesn’t begin to nullify the relevance of the reality that the great bulk of Covid’s dangers are reserved for the elderly.
The second of these realities is that the failure to recognize and act on the distinct age profile of Covid’s effects means that the response to Covid was not only disproportionate to the danger posed by the SARS-Cov-2 pathogen to the general population, but likely harmful to the vulnerable population. Resources are scarce. By spending these resources indiscriminately across the entire population, these resources were not concentrated – “Focused” (as the authors of the Great Barrington Declaration wisely recommended) – on where they would have the greatest positive benefits.
The following analogy (like any other analogy) isn’t perfect, but it conveys an important truth. Suppose that category 5 hurricane Mortimer devastates New Orleans. If so, the appropriate response is to concentrate emergency supplies on that city. A wholly inappropriate response would be to declare as a disaster area the entire United States and send emergency supplies indiscriminately across the country. If the latter course were taken, the toll of death and destruction from Mortimer in New Orleans would wind up being worse than if the emergency response and supplies were focused on that city.
Also scarce are human attention and fellow-feeling. And so just as calamitously as the failure to focus material resources on the vulnerable, by treating Covid as if everyone is at equal risk of suffering from it, human attention and fellow-feeling were spread too thinly. A mother who believes that her fifteen-year-old son and her 45-year-old husband – and she herself – are as likely to die from Covid as are her 75-year-old parents will not concentrate as much of her loving attention and concern on her parents as she would were she aware that she, her husband, and her son are at much less risk of suffering from Covid than are her parents.
No one will ever be able to say for sure if – and if so, how many – lives were failed to be saved by the indiscriminate, unfocused response to Covid (as opposed to the focused response recommended by the Great Barrington Declaration – and by many public-health experts prior to 2020). But I can’t believe that this number is small.
Rob Rawlings
Nov 24 2021 at 2:48pm
Based on the numbers you give 25% of covid deaths have been for people under 65 – which means we are closing in on 200,000 deaths for that age group. If a disease hit us that only affected the under-65 and killed that number of people I am sure that many would voluntarily take protective measures such as mask-wearing, working from home, and avoiding other unnecessary social contact irrespective of any government mandates.
robc
Nov 24 2021 at 4:20pm
Many did voluntarily do those things without government mandates.
So why the need for mandates?
Don Boudreaux
Nov 24 2021 at 4:21pm
Rob Rawlings:
Undoubtedly so. When individuals become aware of a new, or higher, risk, they should – and, I believe, generally do – respond to it. But that response should be proportional to the risk. So while it’s true that, as you say, we’re approaching in the U.S. approximately 200,000 people below the age of 65 who died of Covid, this raw number tells us very little about the additional risk posed by Covid to individuals under the age of 65.
Each individual wants to know what is his or her risk of dying (or otherwise suffering) from Covid. I haven’t now the time to do a thorough search for up-to-date information on Covid’s infection-fatality-rate in the U.S. broken down by age groups. But I think that this Wikipedia page gives information that’s in the ballpark. It shows that the IFR rate is quite low for young people and increases dramatically as you move up the age groups.
The risk of suffering from Covid is much higher for a 64 year old than it is for a 34 year old – and much higher for a 34 year old than for a 14 year old. Also, and although not revealed in this particular data, this risk is much higher for an obese or otherwise unhealthy 64 year old than for a physically fit 64 year old.
What should I – a physically fit, healthy, slim, and fully vaccinated 63 year old – make of an infection-fatality rate of 0.75% (which is the estimated IFR for people ages 55-64 given in the above Wiki link)? I understand that I am still at some risk of being killed by Covid. But it’s not at all clear to me that even if I were unvaccinated that this IFR for my age group counsels me to change my way of life, even in small ways, out of concern over Covid. I’m quite sure that if I were 43 (rather than 63), my learning that Covid has so-far killed nearly 200,000 Americans under the age of 65 would cause me absolutely no additional worries for my health.
I can with confidence say that I’m quite sure about this matter because, even before I was vaccinated this past Spring (a half-year before I turned 63), I had no special fear of Covid – that is, I no more worried about suffering from Covid than I worried about suffering from any of the countless other perils to which I subject myself regularly, from driving in automobiles to walking as a pedestrian along busy urban streets to succumbing too often to the temptation to eat lots of potato chips.
I’m aware that many people regard as irrational the 60-something pre-vaccinated-me having no unique fear of Covid. But I think it’s not irrational. Despite my age, it became clear to me by April 2020 that the risk Covid posed to me is so small that it simply blended in without much notice with the countless other risks that I routinely face. Even if I were still unvaccinated, learning that 200,000 Americans have so far been dispatched by Covid would do absolutely nothing to prompt me to change my way of life.
Rob Rawlings
Nov 24 2021 at 5:21pm
Don,
We live in risk-adverse society and I suspect your view that a disease that kills 200,000 people under the age of 65 should not cause us to alter our way of life may be a minority one.
I agree that much of the reaction to covid has been hysterical and used by those who like state interventions to push their own agenda but I also think that the risk was sufficient to justify sensible adjustments to lifestyle that would reduce risk not only to one’s own health but (by reducing the spread) also help reduce the risk to more vulnerable groups.
I quite like the message of the GBD but when I realized (based on the stats you gave) the high numbers of under 65’s who had died from Covid it rung a small alarm bell in my head
Michael Rulle
Nov 27 2021 at 10:09am
One of the ways we have created additional fears on Covid, is by quoting total deaths—-not per year, but total. It looks unlikely we will stop this practice. For example, deaths of people under the age of 65 who had Covid when they died in 2020 totaled 105,000. A large number. Or 39 per 100,000—or 1 out of 2500. Total deaths by all accidents (not just car) were 52 out of 100,000. Which should we be more afraid of? I do not know, but the latter has more than tripled over the last 20 years. Think of all the mandates we could create to lower accidental deaths.
But these are just mental games with numbers. 1 out of 105 people die every year in America. The issue is not “what difference does it make?”—-the issue is what is the correct public policy. We definitely do not know how many extra deaths were caused by our policies on Covid. We do believe that 25-30% of excess deaths, at least, involved people without Covid. Why? I don’t know—-but we tend to ignore this. Further, Covid’s IFR is very low. For example, if 99.3 out of 100 who contract Covid do not die, why do we assume that 100% of persons who died with Covid died from it——some percent obviously did—-but all? -specifically given the age grouping.
Deaths above what “would have been” matters the most. And these have been large. And it clearly is related to Covid—-including directly and indirectly. The issue is have we caused more to die due to our reaction or less? But a reaction that caused a 30% drop in GDP cannot be the right answer.
Mark Brophy
Nov 25 2021 at 1:58pm
Given that Covid isn’t a danger to you, why did you take a dangerous untested mRNA injection? Was it required by your employer? How many people under 64 did the mRNA injections kill?
Michael
Nov 25 2021 at 6:50pm
If by “dangerous untested mRNA vaccine,” you are referring to either of the 2 mRNA vaccine products authorized for use in the US (the Pfizer and Moderna vaccines), then your claim is completely and utterly false.
Both vaccines were priven safe and effective in randomized controlled trials, the gold standard for assessment of clinical efficacy and safety of novel pharmaceutical products. Since then they have been administered to nearly 200 million people and complied a strong track record of effectiveness and safety in the real world. They haven’t been around for very long but they have been exceptionally well tested during their short lifetimes.
robc
Nov 24 2021 at 4:27pm
CDC says 621 deaths from age 0-17 (And that is all deaths “involving” COVID, not necessarily cause by COVID).
Using your argument, is there any other disease that has killed 621 school aged children over nearly 2 years that would lead to schools shutting down and mask wearing in schools and etc?
That number, by the way, is just under 1% of the all cause deaths in that age group (62,999).
steve
Nov 25 2021 at 11:42am
The problem with the Great Barrington Declaration is that it assumed that we know how to protect those most at risk. We didnt. We still dont, or won’t. Knowing that older people are those most at risk we had more deaths, a lot more, after that first wave. In economic terms you have assumed a can opener.
Steve
Don Boudreaux
Nov 25 2021 at 12:39pm
Steve:
Your claim that we don’t “know how to protect those most at risk” is both out-of-context mistaken.
First the context. The Focus Protection endorsed in the Great Barrington Declaration must be compared with real-world alternatives – and especially with the particular real-world alternative that prompted the Declaration’s creation. That alternative is general lockdowns. No one knew – or had any reason to know – that general lockdowns would work over the long run even to reduce Covid deaths. In addition, collateral damage from the lockdowns was either ignored or simply assumed to be less harmful than the Covid’s consequences would have been with no lockdowns. Evidence is strong that the harm from the lockdowns is significant, and worse than would have arisen had the lockdowns not occurred.
It’s not the authors of the Great Barrington Declaration, me, or any other of the GBD’s supporters who are assuming a can opener; that fallacious move was, and is, done by proponents of lockdowns.
Second the mistake: The authors of the Declaration spelled out here how to protect the vulnerable. I paste below the most-relevant part:
steve
Nov 25 2021 at 9:23pm
Don- None of those had been tried. It was assumed they would work. Can go through them in detail, but lets just take one. Everyone said we should protect nursing home residents. There were a few nursing homes that made heroic efforts and had really good results, but we are talking about very low wage workers and most nursing homes run tight on staff. To save money most have a lot of per diem staff or use agency people. A lot of nursing home staff are themselves older and lot have significant morbidities. You really cant just wave a wand and say you will reduce staff rotations. Where are the staff going to come from? Exactly how do you reduce staff rotations?
This all sounds good to people who dont work in health care. For those who do it sounds like magic. Then throw in all of the “solutions must be found”. What they were proposing is pretty complex with lots of stuff never done before and no idea how to pay for it.
Then, as I noted, if all of this was correct and people were finding solutions then I think we should have expected fewer deaths in the following waves. After all death rates for hospitalized pts had dropped by about 50% after the first couple of months. Instead more died. People either tried some of this stuff and it failed or they werent willing.
Tierney? He is writing a polemic. That was not science or even science based. I read most, probably all of the papers he cites. He misrepresents them. He again cites the 0.2% fatality rate for Covid when we have already had 0.5% of the country die. With all due respect you really ought to read real literature, not City Journal.
Steve
Don Boudreaux
Nov 26 2021 at 9:34am
Steve:
First you assert that Jay Bhattacharya, Sunetra Gupta, and Martin Kulldorff – authors of the Great Barrington Declaration – merely “assumed that we know how to protect those most at risk” with what they called “Focused Protection,” as opposed to with lockdowns. Then when you’re shown a detailed description by these authors of what Focused Protection entails, you dismiss this description by ignoring a key problem that Focused Protection is designed to avoid.
That key problem is resource scarcity. By using general lockdowns, and by treating everyone – including school children – as being equally at risk of suffering from Covid, governments caused resources, attention, and mitigation efforts to be spread too thin. Far too many resources, attention, and mitigation efforts were spent where they had much smaller impact than they would have had were they instead focused on protecting the most vulnerable.
Curiously, your own follow-up dismissal of the practicality of Focused Protection (unintentionally) admits this truth. You write:
You here describe a world racked with lockdowns and, now, vaccine mandates – that is, the world that we actually got instead of a world with Focused Protection – and conclude from this description that Focused Protection is “magic.” But your conclusion is illegitimate. It is precisely because of general lockdowns and mandates that too few resources were focused on protecting the most vulnerable.
Also, it is no good objection to Focused Protection to point out that it would not be 100 percent effective, or to identify difficulties – perhaps even serious ones – with its implementation. No process short of 7.5 million suicides for reducing the spread of the SARS-CoV-2 virus would be 100 percent effective. No process could escape difficulties in its design and implementation. No process for dealing with Covid would be free of challenges, both real and merely imaginable.
The Great Barrington Declaration’s authors proposed Focused Protection not as a means of eliminating all harm from Covid-19. Nor did they deny challenges in its implementation. Instead, they proposed Focused Protection as an alternative to subjecting the general population to unprecedented lockdowns and mandates. Focused Protection is to be judged not against some unobtainable and imaginary ideal but, rather, against the reality of lockdowns and mandates. And by this comparison, it’s seems to me to be impossible to deny that the results of Focused Protection would have been far better along every dimension (save that of concentrating immense discretionary power in the hands of arrogant government officials).
The devotees of magical thinking are not those persons who advocate Focused Protection but, instead, those who believe that salvation is to be found only by spreading hysteria and trusting government officials with the power to pummel human society with unprecedented restrictions of commerce, social, and familial engagement.
Todd Moodey
Nov 26 2021 at 10:36am
Steve–
Near the end of your comment to Don Boudreaux’s post about focused protection, you assert that “…we have already had 0.5% of the country die.” Where does this figure come from? From the numbers I see, it’s more like 0.23% (~770,000 deaths over a total population of ~330 million).
Regards,
Todd Moodey
steve
Nov 26 2021 at 12:01pm
Todd,
Current estimates are that only about 1 in 4 Covid cases have been reported and we have about 45 million reported cases.
Don- I think you are engaging in a false binary. We really did not have instead of Focused Protection a world of continuous, non stop lockdowns. What we got in most places were relatively short, a few months, of general lockdowns and then a gradual decrease in the level of lockdowns with masking persisting in a lot of places. In few of the places with lockdowns was there much of an effort to enforce them letting areas with lower covid rates loosen early without repercussions.
More importantly, as I alluded to before, the changes suggested and never tried by the Barrington guys were what I would expect from a bunch of academics. I chair a medium sized private practice group and have run the business side for 15 years. On t he non-health care side some of what they suggested might have been doable, but you still would have needed some government entity to solve and pay for most of what they suggested. On the health care where I do know a bit what they suggested was fairly complex, requiring either a lot more health care workers, more highly paid workers, a lot fo worker movement and an upgrade in training and abilities for a lot of people.
So at the risk of bragging my practice can change much faster than an academic program. We can accommodate changes in a few months that would take a year or more for an academic program. Since I am one of the people who would have turned this into reality, not some guy sitting at a university, I would have needed a lot of resources since I was also dealing with ICUs that were overcrowded and staff working beyond normal hours. Where would I get the resources, people, equipment and money, to carry out the programs the academics suggest? Realistically there was only one source and that would be government. If there is anything govt is not good at it would be responding quickly to the kind of complex changes proposed by the academics. Government is better when speed counts at large blunt responses.
So if we had the resources, and assuming we didnt have too much government interference or too many strings, I think we could have done a lot of what they suggested but it takes a long time, probably a year, and any solution is tenuous since a surge that required more care in an area leaves you short staffed. IOW we would have needed to accept a lot more deaths in the short run.
Steve
Todd Moodey
Nov 26 2021 at 12:28pm
Steve–
Thanks. I’m not sure how it follows that because the number of cases is allegedly understated by a factor of four that therefore 0.50% of the country has already died from Covid. Is your claim that this case-count understatement means, or implies, that approximately 1.7 million people in the U.S. have ***already*** died from/with Covid?
Regards,
Todd
Don Boudreaux
Nov 26 2021 at 1:10pm
Steve,
I’m the last person to defend the practical abilities of people far from the scene of action, and with little or none of their own skin directly in the game of whatever it is they’re proposing. And so I am the last person to defend the practical abilities of academics, including those of my own.
But one needn’t be a practitioner of any profession or trade to understand this truth: Resources and attention spent in way X cannot be spent in ways Y or Z. This reality is one of arithmetic, and even we academics can understand it. And it is a truth that is central to the Great Barrington Declaration’s recommendation of Focused Protection.
In fact, in one sense we academics – or, at least, we academic economists – are, relative to many practitioners, better positioned psychologically to appreciate the reality of trade-offs. The reason is precisely that we are not focused on any one particular practical project. Persons who are so focused very often are blind to matters outside of their own narrow purview. This fact is one reason, for example, why economists are better able than are steel producers to see both the costs of steel tariffs as well as the benefits. Steel producers see only – or, at least, disproportionately – the latter. (I can’t tell you, sir, how often I and other economists who argue against tariffs have been accused, by producers who are protected by tariffs, of being impractical, egg-headed academics. I think that these accusers are sincere. They are so focused on their narrow doings that they cannot see how the world will work well if the tariffs that protect them are removed.)
And so with sincere respect, just because you as a practitioner cannot see how Focused Protection would work does not mean very much. With literally millions of different people able to experiment with different ways of carrying out the details of Focused Protection, innovative ways, now still unknown, would have been discovered. Knowledge of those ways would have spread. We learn very much by competing with each other, especially when we are free to experiment.
You are, of course, correct that the world did not have binary responses: on one side, no lockdowns, and on the other side, complete and unending lockdowns. But this fact isn’t as relevant as you suppose it to be. The world did have a great number of lockdowns, many of them quite draconian. The world still has many lockdowns, in various degrees, in many places. And in very few places has the prospect of renewed lockdowns become nil. To the extent that we have had lockdowns, we’ve not focused resources and attention; we’ve intentionally largely dispersed resources and attention over the entire population. These are resources and attention that are all wasted. They are resources and attention that could have been, but weren’t, focused where they would likely have had larger positive effects with smaller negative effects.
Again, the relevant comparison is not to an imaginary world in which lockdowns work as promised and with no or little downsides to speak of. The relevant comparison is to the world with the actual lockdowns that we’ve gotten – which is also a world with a new precedent for dangerously enhanced government powers, dangerously attenuated commercial ties, dangerously growing fears of strangers, dangerously expanded government budgets, and dangerously unscientific attitudes toward those who dare to object publicly to the Official Line.
You write near the end of your latest comment:
I believe you. But don’t you realize that the chief reason you didn’t have the resources is because Focused Protection was rejected and replaced with the astonishingly inefficient – that is to say, resource-wasteful – series of lockdowns and mandates?
Further, the fact that Focused Protection, in whatever the unknown details it would have eventually consisted of, would have taken time is, of course, true. But how is this fact an argument against Focused Protection? It’s not at all clear that lockdowns have so far worked even by their own narrow metric of reducing Covid deaths and suffering. But even if they have so far worked on this metric, when lockdowns are eased the virus’s spread increases – thus extending the time that Covid wreaks havoc.
Finally, lockdowns’ and mandates’ collateral damage is real and significant. These policies are not appropriately judged by considering only their consequences on Covid.
I don’t doubt that Focused Protection would have encountered many challenges, some of them serious. And I’m certain that it would not have had a track record of perfection. But because the relevant comparison is of the practicality of Focused Protection with the practicality of locking down, in unprecedented ways, human engagement – social, familial, and commercial – I cannot begin to see how anyone can regard the latter as being the practically more plausible and workable alternative.
Don
Don Boudreaux
Nov 26 2021 at 4:43pm
Steve:
There are two different avenues down which we can and should travel to assess whether or not the Focused Protection advocated in the Great Barrington Declaration (GBD) is more practical than is the alternative – namely, lockdowns – against which the authors of that Declaration warned.
The first avenue is the narrow one of asking whether or not Focused Protection is more practical than are lockdowns at protecting against Covid-19. The second avenue is more broad; on it we ask if Focused Protection is more practical or less practical than are lockdowns at protecting society.
The authors of the Great Barrington Declaration wisely travelled down both avenues.
On the first avenue: Precisely because general lockdowns and mandates combat Covid by expending resources and attention indiscriminately, had the GBD’s recommended Focused Protection been followed, these resources and attention would have been marshaled more rationally. They would have been better targeted at protecting the vulnerable rather than wasted, scattershot, on ‘protecting’ the great majority of the population from what is to them a risk that ranges from small to minuscule.
You doubt that Focused Protection would have worked better than the alternative – lockdowns – against which it was recommended. (Pardon me for being repetitive, but it’s crucial to recognize that the only relevant comparison here is whether or not Focused Protection would have worked better than lockdowns.) For reasons that I explained earlier, I disagree with you that Focused Protection was the worst of the two alternative courses of action for protecting people from Covid.
But even if I’m mistaken on the narrow point – even if lockdowns are the better means of protecting humanity from Covid – the case that Focused Protection is the less practical of the two options is not yet settled. That is, even if lockdowns are the more practical means of protecting people from Covid, as long as humanity attaches any value at all to achievements other than reducing the risk of exposure to the SARS-CoV-2 virus, lockdowns might nevertheless still be impractical as an alternative to Focused Protection.
How practical are prohibitions on factories, trucking lines, restaurants, and other businesses remaining open? How practical are the resulting disruptions of supply-chains – or what I prefer to call “the global supply web”?
How practical are government prohibitions on family gatherings? Prohibitions on people gathering to worship, to mourn their dead, and to celebrate their marriages and graduations? How practical are school closures and the attendant farce of pretending to ‘educate’ six and seven year old children – or even college students – over Zoom? How practical is it to prevent children from socializing and playing with each other? How practical are the prohibitions on travel, with some of these prohibitions even being intra-national? How practical is the quarantining of fellow citizens who are returning from abroad?
How practical is the more than 50 percent increase, in a mere two years, of the annual amount spent by the U.S. government (from $4.448 trillion in 2019to $6.818 trillion in 2021)? How practical is the more than tripling of the U.S. government’s budget deficit from 2019 to 2020? And the still appallingly high budget deficit for 2021?
How practical is the steep increase in the money supply in 2020-21 – and the now-resulting rising inflation?
How practical was the playing, in 2020, of sporting events in stadiums filled only with cardboard cutouts? How practical was it to delay medical diagnoses and treatments for ailments other than Covid? How practical is it for many governments, including many in the west, to outlaw protests against lockdowns? How practical are the unprecedented vaccine mandates for the general population, and the accompanying treatment of the unvaccinated as untouchables?
How practical is the substantial increase since early 2020 of Covid-fear-fueled authoritarianism?
Even if lockdowns prove over time to save more lives from Covid than would have been saved by Focused Protection, this fact would not suffice to render lockdowns the more practical strategy than Focused Protection. Account must be taken of lockdowns’ collateral damage.
Compared to lockdowns, perhaps the greatest advantage of Focused Protection is that whatever collateral damage it would have caused would have been an invisible fraction of the collateral damage caused by lockdowns. This damage from lockdowns was caused precisely because the unprecedented pummeling that society has endured over the past 20 months was indescribably imprudent and frighteningly impractical.
It boggles my mind that, compared to the unprecedented and draconian course that most governments took in response to Covid, anyone can regard the alternative course of Focused Protection as impractical.
Don
Mark Brophy
Nov 25 2021 at 1:48pm
There are 270 million people under 65 so that means that one in 1350 died with a positive Covid test. How many died with Covid and how many from Covid?
Michael
Nov 28 2021 at 7:04am
This idea that people are dying “with Covid but not from Covid” is cleanly refuted by the original post – 2020 saw a massive surge in deaths from any cause. If all that was happening here was that deaths that would have happened anyway were being classified as Covid deaths, then the number of 2021 deaths would stay right around what was expected. That is obviously not the case.
Michael Rulle
Nov 26 2021 at 1:18pm
Don
With the paranoia exploding out of South Africa, perhaps the following is less interesting.
I am writing to you here, because I think you might have some thoughts on this fact pattern ——-that is produced daily by the CDC——which I can get absolutely no one to find problematic——or even interesting. I have asked many academics who write about this on blogs—-no response. Even if you can tell me why it is not either of those things, I would greatly appreciate it. I have no conspiracy theory, just a plain outright shock at its appearance from seemingly nowhere.
In 2020 the CDC produced a 10 year estimate by year of flu deaths. “Past Seasons Estimated Influenza Disease Burden”. Average estimated annual deaths were 36,000 per year—-with a 95%CI that was highly skewed to the upside. We know these are “models”, as they tell us so.
Pneumonia is harder to nail down. But about 30-50 thousand a year appears to be what we have historically recorded. For example, between 1998-2019 approximately 18 per 100,000 have died from either Pneumonia or Flu according to NCHSTATS.com. This translates to 50,000 a year—consistent with CDC number for 2018 for Pneumonia alone.
Since I believe total deaths in excess of what would have been matters the most, I look at CDC’s “Excess Deaths Associated with Covid-19”——particularly the sub category “Daily Updates of Totals by Week and States”
Since May 2020, Flu deaths have totaled 1500—-about 1,000 per year. What makes this more astounding, is that it includes those who also had either Covid or Pneumonia. We have effectively zeroed out Flu deaths.
On the other hand, Pneumonia death counts have skyrocketed. Since 1/1/20 almost 700,000 people have died with Pneumonia—-or about 380,000 per year. This excludes people who had flu and includes those who had Covid. Covid deaths are 775,000 or 422,000 per year.
400,000 deaths include both pneumonia and Covid—-so this number appears in both categories. So even without Covid, pneumonia deaths have tripled to 163,000 per year. Or with Covid——they have increased 7-8x. Have we ever heard anything about pneumonia and Covid? I have not.
It appears clear we have changed how we count. This has not been explained. This does not mean we have not had extra deaths. But how many?
My concern. How did Flu deaths disappear? How did Pneumonia deaths climb so high? What else is counted differently. Our death rate is about the same as the year 2000—-but we always react to change more than absolute percents. What is the right baseline for deaths Ex-Covid? I have read it is understated—-cannot find the essay—-so can’t give it credence yet. Other questions.
How can we know global Covid deaths but not Global total deaths for 2020?
What else is counted differently? World 7000 Covid deaths per day (28% of US rate). Why does Hong Kong average close to 0 deaths per day due to Covid-or Japan 2 deaths per day—-or Australia 3 deaths per day. But we have 1000 per day? Or Canada 20 per day? Or Taiwan 1 per day. France 44 per day. Sweden 2 per day. South Africa 30 per day (the new variant has not killed people yet—so it seems). Spain 17 per day. Israel 4. South Korea 30 per day. Italy 64 per day. Argentina 21. All of these are rates 1/3rd of US or less.
Reasonable questions. Most answers are based on the premise that Covid is undercounted. Maybe—-but on what basis? I bring up how we have changed counting Flu and Pneumonia. This seems like it is something to be investigated.
Michael
Nov 26 2021 at 5:20pm
I am not 100% expert on the data tracking, etc, but basic biology provides some of the answers.
Let’s take Covid-19 and the flu. They have some similarities and differences.
Key similarity: both are caused by infectious respiratory viruses that spread in similar ways.
Key difference: the coronavirus, even before delta, was at least twice as infectious as the flu. (Delta is about twice as infectious as the original coronavirus.)
Because of this, any public health measures that are effective at slowing/stopping the spread of Covid-19 are exponentially more effective at stopping the spread of the flu. All of the voluntary and mandated measures that have slowed the spread of Covid-19 were even more effective at slowing the spread of the flu.
I have been 100% work from home since March 2020. So the chance of my picking up Covid or flu from work since then has been 0%. Schools were closed for a long time – that reduces the spread of the flu. Masks have some effectiveness against Covid-19, even more against the flu because it spreads less readily.
So that is why flu cases crashed.
I’ll less certain about pneumonia, other than that people who die from Covid tend to have pneumonia so some death certificates may list it.
Charley Hooper
Nov 24 2021 at 2:39pm
Even if the rate of baseline diseases stays constant during a pandemic, the data may be hiding important insights.
Example 1: A person gets a normally treatable heart attack in September 2021 but, because of the ramifications of COVID-19 (lockdowns, social distancing, fear, hospital precautions, obesity, isolation, depression, etc.), actually dies. A person who would have died of a heart attack in December 2021 gets COVID-19 and dies from that in September 2021.
There’s still one heart attack death in 2021 but it was the “wrong” person who died. We have two deaths were we would have had one. To keep the number of deaths from heart disease constant in 2021, one extra person died (unnecessarily) from heart disease.
Example 2: A person who would have died from heart disease in June 2022 dies from COVID-19 in December 2021.
In this case, we would expect to see 2022 deaths from heart disease decline. We would need to see 2022 data to really understand what happened. Given that the data shown above extends through 2020, I don’t think we have a complete picture of what’s really going on.
Michael
Nov 25 2021 at 7:21am
What I like about these examples is that both are interesting research questions amenable to further investigation. Particularly example 1. You focus on policy impact on access to medical care as a potential factor that increases deaths due to otherwise preventable causes. I would add a non-policy impact that could have the same effect: hospital overcrowding and excessive demand on heath care providers and facilities.
The analysis in this post, focused on the US as a whole over a long time period, collapses all of the differences of timing and geography. Covid waves affected different parts of the country in different ways at different times. The policy response to Covid also varied across place and time. Likewise for non-policy factors such as hospital overcrowding and excess demand on the system.
When and where the excess deaths occurred versus the location and timing of Covid waves vs those of Covid policies that restrict access to providers is an analysis that could and should be done.
Comments are closed.