
A July 23 Economist article about how “Generous Unemployment Benefits Are Not Keeping Americans from Work” is not easy to understand. “[T]here is little evidence,” it claims, “to suggest that the extra $600 a week [from the federal government] is slowing down the labour-market recovery.” One would think that paying more in benefits to non-working workers would, ceteris paribus, decrease their number. Consider the last two paragraphs of the article:
Another signal that employers were struggling to fill positions would be soaring wages. Workers might hold bosses hostage with the threat of settling for benefits instead. Upon first inspection, this seems to be true. Average hourly earnings in the second quarter of 2020 increased by about 7% from a year ago, according to Goldman Sachs. However this is largely because low-paid workers have lost jobs in disproportionate numbers, dragging average wages upwards.
All of this implies that the main factor behind the high unemployment rate is lack of jobs, not an unwillingness to work. Economists normally fight like cats in a bag. But an astonishing 0% of those surveyed by researchers at the University of Chicago disagreed with the idea that “employment growth is currently constrained more by firms’ lack of interest in hiring than people’s willingness to work at prevailing wages.”
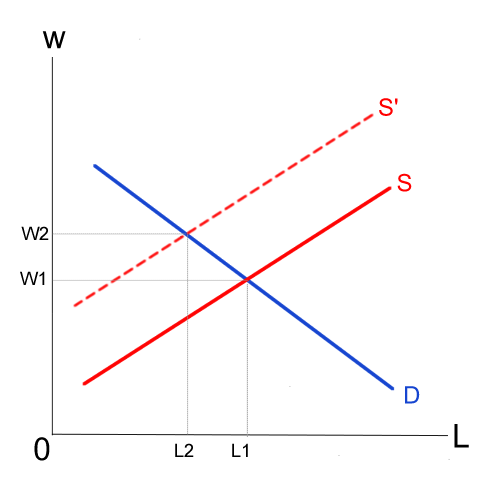
Excluding the misleading last sentence, the first paragraph tells us that, in the second quarter, employment decreased and wages increased, which is confirmed by the chart below (shaded area marks the current recession).
Consider Q2. How could employment decrease while wages increased (all compared to the same quarter one year ago)? Assuming a negatively sloped demand for labor and a positively sloped supply of labor, the only way this combination can obtain is if supply has decreased, that is, the supply curve has shifted to the left. The demand curve may also have shifted, up or down (most likely down in the current outlook), but we know that the dominant factor must have been a decrease in supply.
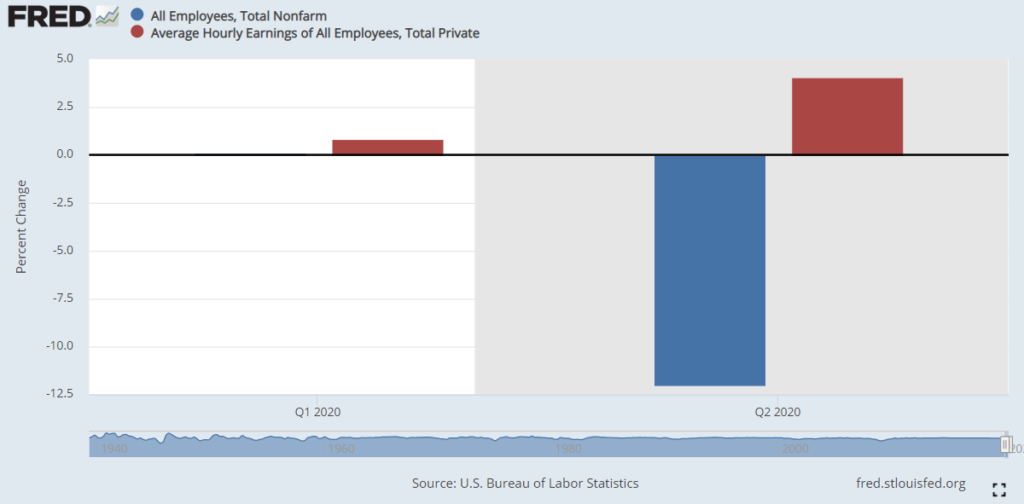
This is easy to see with a standard supply and demand analysis. The chart below pictures the labor market with demand curve D and supply curve S. Employment and the wage rate were respectively L1 and W1 before Q2. For L1 to decrease to L2 and W1 to increase to W2, you need to have a decreased supply, at S’, that more than compensates for any decrease (or increase) in the demand for labor. Playing with S and D should persuade you of that. (You may want to refer to my post “A Frequent Confusion and the Yo-Yo Model” if you need a more detailed explanation of supply-demand analysis—albeit in a product market instead of a labor market.)
What seems to have happened is the opposite of what The Economist tells us. The dominant factor behind the lower employment is that workers reduced their supply of labor, presumably because, with the $600 federal unemployment supplement, many were paid more non-working than working—and no doubt also because many were too scared of the pandemic to go back to work. The higher unemployment rate (not shown on the chart and again compared to Q2-2019) probably results from the workers who, in the states where it does not compromise their unemployment benefits, chose not to go back to work and not to look intensively for a new job. There is certainly a “firms’ lack of interest in hiring” (compared to what it was before) but the dominant factor is “unwillingness to work.” If that were not the case, wages would not have increased.
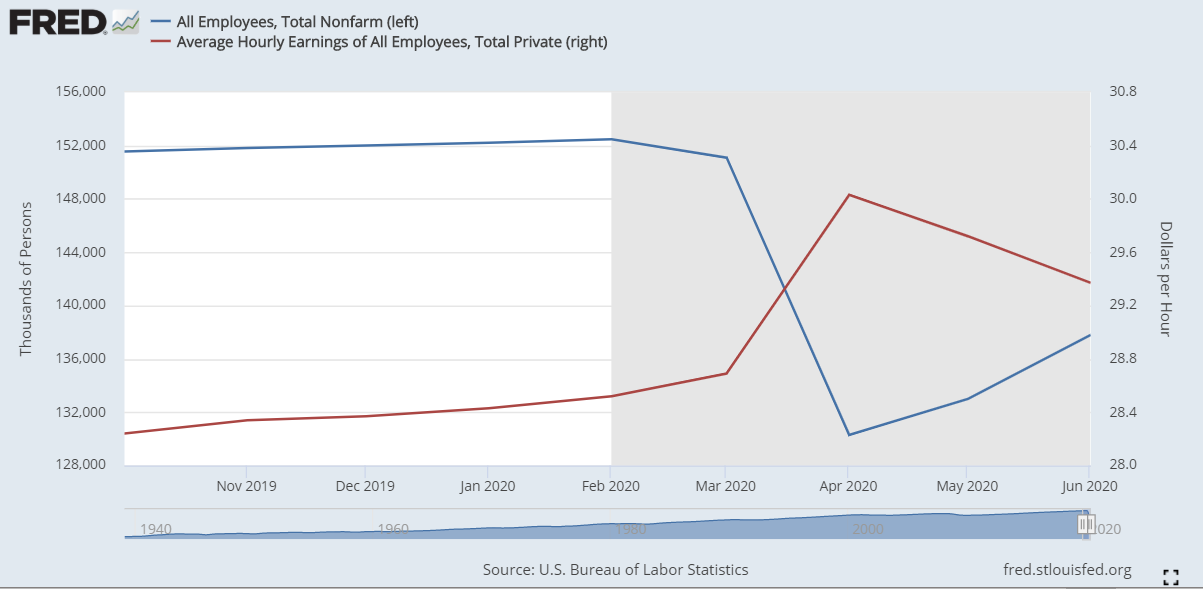
One way to question this conclusion, besides making strange assumptions about the supply or demand curves, would be to suggest that percent-change calculations with respect to the preceding quarter (as opposed to the same quarter a year before, as was done in the first chart) would be more representative of short-run changes in supply and demand. The following chart shows that doing this does not change the general picture and thus our conclusion for Q2. (The picture for Q1, with a very tiny increase in employment of 0.09%, suggests that the overall demand for labor rose enough to compensate the unemployment effect of the reduction in labor supply. This is likely an artifact of Q1 being very economically heterogeneous, from a slow start in January and February to a catastrophic drop in March.)
This little analysis of the respective effects of labor supply and labor demand is also confirmed by the monthly evolution of employment and wages (see chart below). In the second quarter and the end of the first, employment and wages moved inversely, implying that the supply of labor played the main role, not the demand for labor.
If all that is correct, the burning question is why none of the 43 economists polled by the Chicago Booth School of Business disagreed with the statement that that “employment growth is currently constrained more by firms’ lack of interest in hiring than people’s willingness to work at prevailing wages.” Perhaps these economists were secretly playing with supply and demand curves in their heads, as the comments of Caroline Hoxby and Darrel Duffie suggest. But they should all come out of the closet.
READER COMMENTS
Chris Burfield
Aug 2 2020 at 4:52pm
Sorry, until job openings return to pre-pandemic levels I don’t think you can make the argument that expanded benefits are keeping unemployment high.
See this chart: https://www.bls.gov/charts/job-openings-and-labor-turnover/unemp-per-job-opening.htm
Pierre Lemieux
Aug 2 2020 at 6:30pm
Note that my analysis is not about unemployment (in the sense of involuntary unemployment) but about employment (and voluntary unemployment–everybody is voluntary unemployed during his vacation and a large part of the day). And I did add a sentence to reconcile this with the calculated unemployment rate. The question is what has had the most effect on employment: supply or demand. I can’t see how the JOLTS statistics contradict my conclusion: they just mean that the demand for labor has decreased, but if that had been the main factor, wages would have decreased too.
Craig
Aug 2 2020 at 6:52pm
“they just mean that the demand for labor has decreased, but if that had been the main factor, wages would have decreased too.
The last BLS report we see: “In June, average hourly earnings for all employees on private nonfarm payrolls fell by 35 cents to $29.37. Average hourly earnings of private-sector production and nonsupervisory employees decreased by 23 cents to $24.74 in June.” — https://www.bls.gov/news.release/empsit.nr0.htm
Considering the economic calamity, not too bad at first glance, right?
However, what I hypothesize is happening can be illustrated by a simple example. Imagine a work force of 100 people earning $1…..$100 … sum(1….100) = $5050 total wages / 100 = average wage of $50.50
Now let us assume that a pandemic strikes causing 15% unemployment which we will assume strikes the bottom 15 individuals. sum (16….100) = $4,930 / 85 = average wage of $58.00
Pierre Lemieux
Aug 2 2020 at 10:27pm
@Craig: Yes, but with three clarifications useful for a proper understanding: (1) You can see the June decrease in wages (as the supply of labor increased) on my last chart. (2) If the supply of labor decreases, as overall in Q2, you move along the demand curve, which represents the value of the marginal product of labor; as the marginal product increases, wages necessarily increase, but employment diminishes. If you had just one worker in the economy, his wage would be bid up very high. (3) As some people choose not to work, the average but more importantly the marginal wage increases (the marginal drives the average, not the other way around).
Michael Pettengill
Aug 3 2020 at 5:51am
The ticket taker, food hawker at the sports event drives the willingness of the star athlete being willing to get sick with COVID-19?
Or is the ticket taker, food hawker who drives the work-at-home salary worker to take his family to sports events to risk getting COVID-19?
It was fear of COVID-19 that caused high income consumers to cut back their consumer spending, thus cutting revenue, not the low income consumers who work the sports events.
Craig
Aug 2 2020 at 5:34pm
It should be self evident that unemployment should not be more lucrative than the job lost. $600/wk is $31,200 per year year on top of the amount typically provided by the state. This amount obviously varies, but right now in NJ one was able to collect $714 + $600 = $1,314 * 52 = $68,328. Even in more miserly states like FL, one can collect $275 + $600 = $875 * 52 = $45,500.
The last two BLS reports suggest that the economy has been adding jobs. Indeed, to the extent that employees are simply recalled to their former positions, the old legal standard will apply, ie an employee must be ‘ready, willing and able’ to work. So if an employee refuses a recall, that employee will, typically, forfeit future benefits (an employee can only voluntarily resign/quit for ‘good cause attributable to the work’).
However, once collecting the expanded benefits, there is no incentive to finding suitable work with a different employer for those making more on unemployment.
Given the recent termination of the expanded federal benefit on July 31st, this coming BLS report will be particularly interesting inasmuch as people are likely to have started taking positions in anticipation of the termination of the extra $600, even if the program is ultimately extended by Congress.
Anecdotally I did see how the expanded benefit increased the reservation wage in the legal freelancer economy where post-pandemic offers were routinely rejected by contractors simply because the rates offered weren’t enough to actually work for even if one could earn more than unemployment. The agencies initially offered lower rates thinking contractors would take the lower rates, but had to raise rates to compensate for ‘unemployment on steroids’
Michael Pettengill
Aug 3 2020 at 5:31am
In Florida a worker earning $8 at 35 hours a week gets $275 a week in unemployment?
And I thought it was 50% of the average for your best quarter in the prior year, which might have been, depending on your job, snow bird season, or 2019 summer party time.
The job you return to in 2020 could easily have lots fewer hours at lower wages and tips.
Which means the idea that lower income drive higher GDP argues the best way to get GDP growth to 25-50% is tto have a global wage income cap of $1000 a week, or better yet $500. With 50% of high cost workers getting much lower wages, consumer demand changes will hyperdrive GDP growth!
Craig
Aug 3 2020 at 9:29am
“In Florida a worker earning $8 at 35 hours a week gets $275 a week in unemployment?”
$275 is the max in FL, $714 is max in NJ
“And I thought it was 50% of the average for your best quarter in the prior year”
Sounds about right from what I just googled, but of course $275 is the cap so if you make more than $28,600 which is a significant percentage of the population in FL, you will just get the max and at least thru 7/31 it will be that max + $600.
Laron
Aug 2 2020 at 7:35pm
I find this analysis convincing, but my quick perusal of Ernie Tedeschi’s work and Dube’s work also seem pretty convincing in showing UI having little to no explanatory power right now.
Could this be another instance of how economic reasoning vs econometric formulations lead to different conclusions?
Pierre Lemieux
Aug 3 2020 at 12:15am
@Laron: I am not persuaded that either Tedeschi or Dube has a defensible argument, but not for the reasons you suggest. If I am not mistaken, Dube’s work was only about the Great Recession; the evidence I present above is for Q2-2020 (and the end of Q1) in the current recession. Moreover, Barro’s work contradicted it. Again if I am not mistaken, Tedeschi shows nothing but two simple regressions for April and May, without any statistical analysis nor clear theoretical foundation. Moreover, as you can see on my last chart above, April and May were two very different months: the first showed a big drop in employment, and the second one (together with June) a (merely) partial recovery of employment. According to my analysis above, the reduction in the labor supply (presumably caused by both UI and the fear of the pandemic) in April was the major factor in the drop of employment; while a smaller (non-compensating) increase in labor supply in June was the major factor in the partial recovery of employment. The explanation of the net employment decrease in Q2, as explained in my post, is mainly a decrease in labor supply, not the decrease in the demand for labor.
Laron
Aug 4 2020 at 3:30am
Mahalos, that makes sense. The Dube research is linked here if you want to see his more recent argument:
https://twitter.com/crampell/status/1290306228728418304?s=19
Brandon Berg
Aug 3 2020 at 2:07am
Doesn’t this analysis rely on an assumption of homogeneity in the labor market? If there was a disproportionate decline in demand for unskilled labor (e.g. bars and restaurants), then we might see average wages increasing even while the labor supply remains constant. The increase in average wages would be driven by a shift in the distribution of types of labor employed in the economy, and not by an an increase in price for any particular kind of labor. It’s even possible for average wages to rise while every individual worker’s wages fall, which would be a textbook example of Simpson’s paradox.
Pierre Lemieux
Aug 4 2020 at 8:03pm
@Brandon Berg: Interesting reference to the Simpson Paradox, but I don’t think it applies here. If every worker’s wage decreases, the average wage cannot increase, however you partition workers (because the average wage is always calculated by worker and they are the same workers). If the note of every student in a class decreases, the average note cannot increase (because the average note is always calculated by student and they are the same students).
Michael Pettengill
Aug 3 2020 at 5:20am
The employer demand for labor is higher when consumers spend $400 a week buying stuff from the employer?
Note, most of the jobs lost are at employers who serve middle to high income consumers who have cut way back on consumer spending because they fear getting sick from going out to eat, going to bars, going to live entertainment. Many work from home so the $600 does not apply to them, but the tips they left collectively might have added $600 a week to some server paychecks. But cutting unemployment benefits to food workers will not restore the tips when fear of sickness means just ordering takeout or cooking at home.
So, the logic is the waitress should be forced to work for hundreds less while bills are at best constant, ending up with the waitress becoming homeless.
By that logic, increasing the number of homeless will boost GDP.
Thomas Hutcheson
Aug 3 2020 at 8:04am
If this is correct, would it not support a shift from an $x top up to a system that replaced a high percentage of lost compensation (ie including lost health insurance) to insure that some incentive to return to work remained?
Daniel
Aug 3 2020 at 9:29am
Instead of supply and demand for labor, why not analyze this as supply and demand for jobs? Then “supply” and “demand” are inverted and correspond to The Economist’s statements and also the gist of how they were talking about it. Just look at job openings (FRED: JTSJOL) to see that it’s not employers struggling to fill a bunch of open positions all of a sudden, a large chunk is that the positions were going away.
Plus, the analysis is a bit trickier this time as a bunch of employees were made temporarily unemployed by lockdown. So even those who wanted to supply their labor at market prices (or demand a job at their net marginal product) could not as the market was put on ice.
Pierre Lemieux
Aug 3 2020 at 10:31pm
@Daniel: The reason why the supply of, and demand for, jobs cannot be usefully modeled is that jobs are not the goods actually exchanged. When slavery existed (or where it still exists), a supply of, and demand for, slaves can be defined–although the analogy is not perfect. To get closer to a market for jobs, one would have to suppose that the holders of offices in Ancient-Régime France could sell the jobs they owned (I don’t think they could). Rob Blagojevich was sentenced for trying to sell Obama’s senate seat but that was obviously a black and not very liquid market (Trump commutated his sentence). On a market when nobody has a property right in jobs or persons, what is exchanged are labor services.
Jon Murphy
Aug 3 2020 at 10:43am
Pierre-
I think one thing that greatly helps your case are the JOLTS numbers. The numbers are down, yes, but nowhere near 2009 levels. JOLTS are down ~23.0% from the pre-recession levels. To put that in context, in the Great Recession, they fell 53.6%. In 2001, they fell 27.6%. If we look at JOLTS in terms of the subsequent decline in GDP, the current trend looks to be the mildest on record; the decline in JOLTS is very much less severe than the decline in GDP would suggest compared to 2008.
Anecdotally, here in Maryland, a number of stores have signs on their windows offering wages high above the market rate. Five Guys Burgers & Fries is offering nearly $16/hr ($14 plus “Hero pay” of $2). Wies (a local supermarket chain) is doing the same. Given these signs have been up for about a month, even at $16/hr they are having trouble getting workers.
Granted, a lot is going to happen over the next few months. But initially, I cannot see how one can claim UI hasn’t had an effect.
Pierre Lemieux
Aug 3 2020 at 12:49pm
Good point about JOLTS, Jon.
Craig
Aug 3 2020 at 3:42pm
Just so that both of you can see what the other side of the debate is offering here:
https://www.yahoo.com/huffpost/mnuchin-unemployment-aid-work-study-114626183.html
Which then links to the study here:
https://tobin.yale.edu/sites/default/files/files/C-19%20Articles/CARES-UI_identification_vF(1).pdf
I’m obviously no adherent to it but I will say there is NOTHING anybody can say that will make me believe people weren’t willing to take more money by doing nothing than getting jobs that paid less.
robc
Aug 3 2020 at 12:29pm
Anecdotal only, but I have seen UI have an effect. I get my hair cut at Great Clips. There used to be 4 near me, only 2 have reopened. I was getting my hair cut at one and asked when my preferred one was going to reopen. She normally worked there and would prefer it also, but they can’t get enough stylists to fill more than 2 stores.
Basically, 50% of the stylists haven’t come back to work, I assume because of the $600. I will see how quickly the other 2 locations reopen with only $200 (or nothing).
Pierre Lemieux
Aug 3 2020 at 12:51pm
@ROBC: There is a lot of such anecdotical evidence. I suspect that all small business owners would confirm.
Comments are closed.