This post is a follow-up to my recent post on the “masquerading problem”. Recall that changes in interest rates are not a reliable indicator of changes in the stance of monetary policy. A new paper by Marek Jarociński and Peter Karadi discusses an interesting method of identifying monetary shocks:
Central bank announcements simultaneously convey information about monetary policy and the central bank’s assessment of the economic outlook. This paper disentangles these two components and studies their effect on the economy using a structural vector autoregression. It relies on the information inherent in high-frequency co-movement of interest rates and stock prices around policy announcements: a surprise policy tightening raises interest rates and reduces stock prices, while the complementary positive central bank information shock raises both. These two shocks have intuitive and very different effects on the economy. Ignoring the central bank information shocks biases the inference on monetary policy nonneutrality.
I see this as a promising first step toward the market monetarist goal of using asset prices linked to NGDP as an indicator of monetary policy. To be sure, stock prices are a very noisy indicator of NGDP expectations, but they are better than changes in short-term interest rates, which often don’t even have the right sign. Tight money can occasionally cause lower nominal interest rates, as NeoFisherians have pointed out. In the Jarociński and Karadi paper, only interest rate increases associated with falling stock prices are identified as an actual move toward tighter money. Ideally we’d replace stock prices with NGDP futures prices.
This article was sent to me by Basil Halperin, who also made the following comment about my earlier masquerading problem post:
The Wolf paper mentions the “sign restrictions” identification strategy that is usually credited to Uhlig (2005). . . .
I think of your 1989 JPE with Silver as having done a proto-version of this approach! Both your paper and the Uhlig paper use the idea that “monetary shocks should send output and inflation in the same direction” to identify which episodes are demand shocks, versus which are supply.
Readers who are studying economics might be interested in the background of our 1989 JPE paper. In the late 1980s, I was interested in studying business cycles. When I looked at the data, the 1920-21 depression seemed like the purest example I could find of a stereotypical business cycle. It saw the steepest one-year drop in industrial production, the steepest one-year drop in the monetary base, the steepest one-year drop in the price level, and the steepest one-year rise in real wages. This made me sympathetic to the sticky wage theory of the business cycle, which is based on the idea that a severe deflation is contractionary because wages fall more slowly than prices.
Later I discovered research that found real wages to be procyclical, falling rising during booms and rising falling during recessions. This surprised me, so I tried to reconcile these results with the evidence from 1921. It turns out that the more recent studies that found procyclical real wages tended to rely heavily on some business cycles associated with the two oil shocks (1974 and 1979), which were periods when inflation rose and real wages fell during recessions.
Steve Silver and I responded with a study that divided business cycles up into two types, those with procyclical inflation (like 1921) and those with countercyclical inflation (such as 1974 and 1979). Real wages were countercyclical during demand-side recessions such as 1921 and procyclical during the supply-side recessions of the 1970s. This pushed me even more firmly into the sticky wages camp, as both findings are consistent with the idea that nominal wages are sticky when the price level moves suddenly and unexpectedly.
This work also dovetails nicely with my general view that NGDP is a good measure of monetary policy. During supply shocks, prices and output move in the opposite direction, and NGDP doesn’t necessarily change all that much. In contrast, tight money causes both falling prices and falling output. If nominal wages are sticky then this results in higher real wages and higher unemployment. This is why I later switched my focus from price level shocks to NGDP shocks. NGDP measures monetary shocks better than does the price level. George Selgin also reached this conclusion a few decades back, albeit for a slightly different set of reasons.
Perhaps it might seem “unscientific” to base one’s views on a single episode like 1920-21. But my view is that extreme events are very revealing. Yes, you should not use data mining to test a model, but data mining is a very good way to develop a model. Then test it with a completely different set of data. I’d encourage younger economists to pay close attention to Fed announcements that led to unusually pronounced real time market reactions, such as January 2001, September 2007 and December 2007. In those cases, the background “noise” is less likely to disguise the causal relationships. In my book on the Great Depression I discuss numerous such natural experiments.
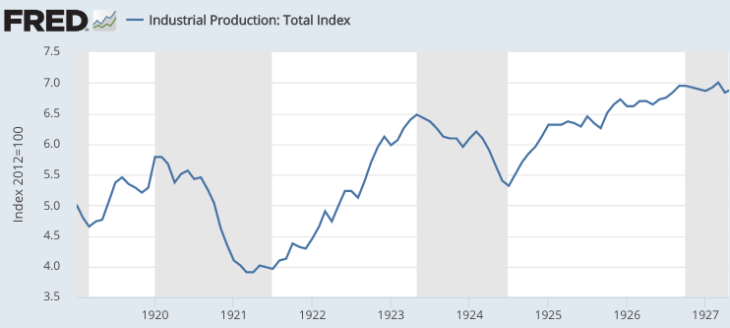
PS. There was a slightly steeper drop in IP right after WWII, but that was clearly a very unusual business cycle. There was a larger drop during the Great Depression, but spread over a much longer period of time. So I believe 1920-21 is the purest negative demand shock. Furthermore, the drop in demand was not endogenous. It wasn’t partly caused by bank failures as in the 1930s; it was almost entirely due to the Fed sharply reducing the monetary base.

READER COMMENTS
Thomas Hutcheson
Oct 6 2020 at 7:49am
Is it not odd that they do not use TIPS inflation expectations as an indicator of policy?
As for asset prices as an indicator of real GDP, has anyone looked at sub indices that might differentially react to changes in expectations of IR or changes in markups v changes in output?
Announcements of policy are also noisy as there can be differences in interpretations of whether the CB is in fact telling the truth about its intentions. This seems quite apparent in the recent announcement that the Fed would target the PL trajectory only to see the TIPS fall pretty smartly.
Scott Sumner
Oct 6 2020 at 3:12pm
Note that the Fed did not announce a price level target.
But yes, TIPS spreads would be a good substitute for stock prices.
John Hall
Oct 6 2020 at 8:25am
The sharp rise in nominal wages during the current recession has been pretty interesting as it was primarily due to significantly larger employment declines of those who are paid lower wages. I can’t recall a similar movement in wages that quickly. In this case, any individual workers wages may have been sticky, but real wages as an aggregate were not.
Anyway, to your point about procyclical and countercyclical wages. I think it helps to split NGDP into labor compensation and some other stuff. Labor compensation is easier to think about. Labor compensation = hours_worked * real_wages * prices (where hours_worked can also be decomposed into workers*avg_hours). So if you have a decline in labor compensation in a recession, it can be decomposed into how much each of these components drive it. There may be good reasons why different components move in different ways in each recession depending on the structure of the economy and the shocks that hit it.
Scott Sumner
Oct 6 2020 at 3:11pm
Good points.
Jeff G.
Oct 6 2020 at 12:45pm
You wrote “Later I discovered research that found real wages to be procyclical, falling during booms and rising during recessions.”
But I think you meant “…rising during booms and falling during recessions.”
Scott Sumner
Oct 6 2020 at 3:10pm
Thanks, I fixed it.
Comments are closed.