Inflation Last Time

In the year to June, the Consumer Price Index increased by 9.1%, “the largest 12-month increase since the period ending November 1981.” Back then, the rate was declining from its peak of 14.6% in March and April 1980 and would bottom out at 2.3% in July 1983. What caused that inflation? How was it slowed?

In the 1960s, monetary policy was grounded in a concept called the Phillips Curve. This held that there was an inverse relationship between inflation and unemployment so that as one rose the other fell. Policymakers could buy lower unemployment at the price of higher inflation and vice versa.

At the end of the 1960s this relationship broke down. The inflation rate rose from 1.6% in 1965 to 5.9% in 1970 but unemployment rose too, from 3.5% in 1969 to 6.0% in 1971. Federal Reserve chairman Arthur Burns complained:

“The rules of economics are not working in quite the way they used to. Despite extensive unemployment in our country, wage rate increases have not moderated. Despite much idle industrial capacity, commodity prices continue to rise rapidly.”

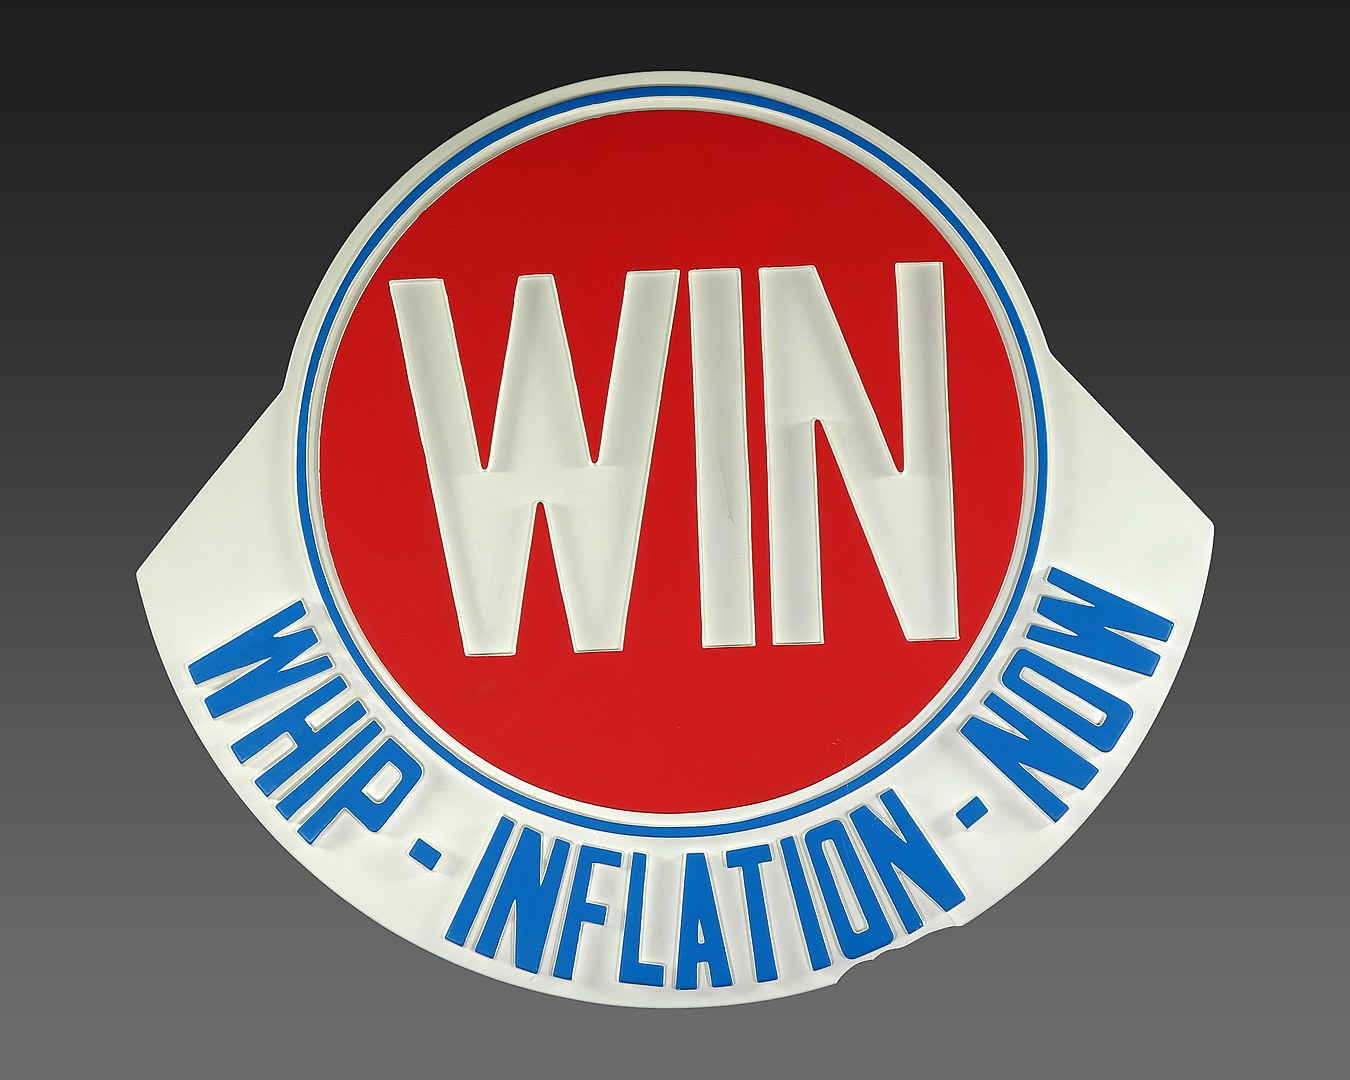
In 1971, President Nixon imposed wage and price controls but inflation went on rising. The CPI rose by 11.0% in 1974 and President Ford launched the ‘Whip Inflation Now’ – WIN – campaign, whose most memorable component was the wearing of badges reading ‘WIN’. And unemployment continued to rise, hitting 8.5% in 1975. In 1978, with inflation at 7.6%, President Carter, said:

“Inflation is obviously a serious problem. What is the solution? I do not have all the answers. Nobody does. Perhaps there is no complete and adequate answer.”

This wasn’t quite true. Based on his monumental study with Anna J. Schwartz, A Monetary History of the United States, 1867–1960, the economist Milton Friedman – who had exposed the Phillips Curve fallacy in 1968 – had long been arguing that:

“Inflation is always and everywhere a monetary phenomenon in the sense that it is and can be produced only by a more rapid increase in the quantity of money than in output.”

Friedman rejected popular inflation bogies, notably the energy price hikes of “Arab sheikhs and OPEC:”

“They have imposed heavy costs on us. The sharp rise in the price of oil lowered the quantity of goods and services that was available for us to use because we had to export more abroad to pay for oil. The reduction in output raised the price level. But that was a once-for-all effect. It did not produce any longer-lasting effect on the rate of inflation from that higher price level.”

He contrasted the low inflation of Germany and Japan, which imported all their energy, with the high inflation of the United States, “which is only 50 percent dependent, or…the United Kingdom, which has become a major producer of oil.”

The key variable was monetary policy. Inflation was not an impenetrable mystery: it resulted from printing money at a rate greater than the expansion of the real economy. It followed that if you controlled the growth rate of the quantity of money, you could control inflation.

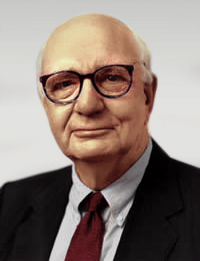
In July 1979, Carter appointed Paul Volcker Fed chair. He knew what he was getting. On their first meeting, Volcker told the President “You have to understand, if you appoint me, I favor a tighter policy than [his predecessor].”

Volcker proved as good as his word. In October, he initiated a fundamental change in Fed policy. Changes in the daily level of the fed funds rate “tended to be too little, too late to influence expectations,” Volcker recalled, “We needed a new approach.”

“Put simply, we would control the quantity of money (the money supply) rather than the price of money (interest rates). The widely quoted adage that inflation is a matter of ‘too much money chasing too few goods’ promised a clear, if overly simplified, rationale.”

Interest rates would fluctuate and as money growth slowed, rates rose: rates on three-month Treasury bills exceeded 17%; the commercial bank prime-lending rate hit 21.5%; mortgage rates approached 18%.

The consequences were brutal. Real GDP fell at an annual rate of 2.1% in the second quarter of 1980 and the unemployment rate rose from 5.6% in May 1979 to a peak of 10.8% in November and December 1982. To his credit, Carter, unlike his predecessors, did not push Volcker to loosen policy, even as he entered an election year. Ronald Reagan defeated him in a landslide.

Volcker had once advised Nixon, “If you have to have a recession, take it early.” Reagan did and reaped the rewards. Real GDP growth hit 7.2% in 1984, the inflation rate fell to 1.9% in 1986, and unemployment to 5.3% in 1989. It was ‘Morning in America,’ Reagan said, and he was reelected in a landslide.

Then, as now, ‘it’s the money supply, stupid.’


READER COMMENTS

Spencer Bradley Hall
Aug 29 2022 at 9:31am

It’s Keynesian economic folklore. Banks aren’t intermediaries. Banks don’t lend deposits. Deposits are the result of lending. Stagflation was predicted in 1961. So was secular stagnation. It’s stock vs. flow. All bank-held savings are lost to both consumption and investment, indeed to any type of payment or expenditure.

“The only relevant test of the validity of a hypothesis is comparison of prediction with experience.” – Nobel Laureate Dr. Milton Friedman

The Great Inflation was due to the “monetization of time deposits”, the virtual end of gated deposits as well as a flawed monetary policy (the FED Funds “bracket racket”).

Monetarism involves controlling total reserves, not non-borrowed reserves as Paul Volcker found out. Volcker targeted non-borrowed reserves (@$18.174b 4/1/1980) when total reserves were (@$44.88b). Volcker stopped the acceleration in inflation by imposing reserve requirements against NOW accounts.

Spencer Bradley Hall
Aug 29 2022 at 9:41am

re: “Then, as now, ‘it’s the money supply, stupid.’”  It’s astonishing.  The rate-of-change in monetary flows (our means-of-payment money supply), the volume and velocity of money (the 24mo proxy for inflation), hit a multiple of any U.S. historical peak.

But it’s complicated by the “demand for money” (idle funds).

The cash/drain factor has fallen from 1.103 on 2/1/2020 to 0.440 on 7/1/2022. I.e., there is a huge volume of saved DDs, excess liquidity, in the economy.

Pierre Lemieux
Aug 29 2022 at 10:52am

John: You reminded us of important historical facts.

Comments are closed.

RECENT POST

I have a new piece at The Hill, discussing the prospects for a soft landing: A useful definition of a soft landing would be a period of at least three years of economic growth with low inflation even after the labor market has full recovered from recession. Surprisingly, there is no evidence that the United States h...

Read More

The New York Times and Wall Street Journal editorials on the Mar-a-Lago search affidavit were more or less as expected. The New York Times argued expansively that nobody is above the law, including a current or former president. The Wall Street Journal (which tried hard to love Trump during a few years but understandab...

Read More

In the year to June, the Consumer Price Index increased by 9.1%, “the largest 12-month increase since the period ending November 1981.” Back then, the rate was declining from its peak of 14.6% in March and April 1980 and would bottom out at 2.3% in July 1983. What caused that inflation? How was it slowed? In the...

Read More