
Alex Tabarrok says no:
as other countries reach current US levels of income their health care spending will look more like the United States does today.
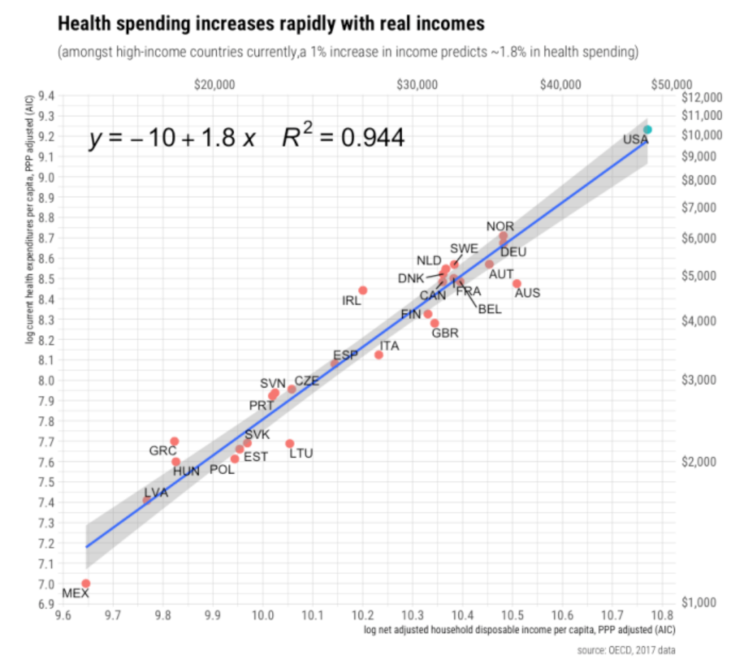
I’m skeptical of this prediction. According to the IMF, there are 11 economies that already have higher per capita income than the US (PPP adjusted) and they all spend far less on health care as a share of GDP. (The second link doesn’t include Hong Kong and Macau, but I found other data suggesting low health care spending in those two city-states.) Admittedly many of these 11 countries are “weird” and thus plausible outliers, but even semi-normal rich countries like Switzerland and Norway spend far less. So how does Alex reach this conclusion? He provides a graph showing a link between health care spending and net adjusted household disposable income per capita:
I’m not sure why the study he cites chose “net adjusted household disposable income per capita” as the independent variable, and given that it did chose this variable I’m not sure why Alex referred to “income” in the sentence I quoted at the beginning of the paragraph. Does it make a big difference? Look at another graph, this one with actual “income” on the horizontal axis:
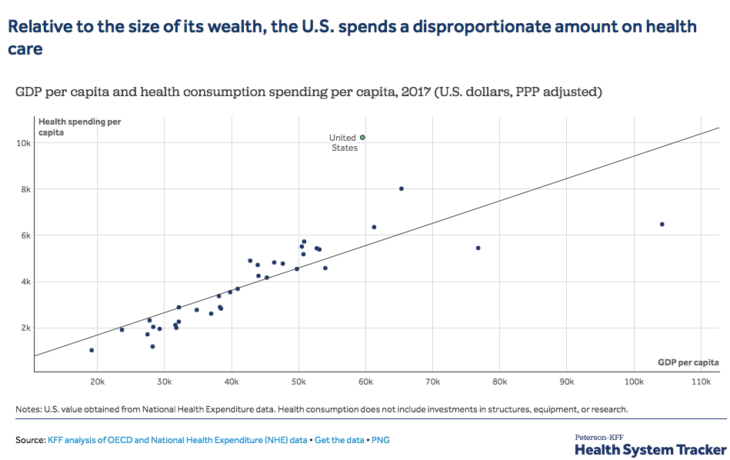
Now the US looks like a huge outlier. What explains the difference? I’m not sure. I’m also not sure why “net adjusted household disposable income per capita” is the correct income measure. I could see using disposable income if you were looking at automobile purchases. After all, people buy cars out of their disposable income. But health care is provided by the government in many countries on the graphs above, not purchased out of disposable income. Where taxes are high, disposable income is often a smaller share of GDP than in the US. But why compare health care spending to a measure of income that is not generally used to buy health care? Maybe I’m missing something.
In my view, the reason the US spends 17% of GDP on health care is that our insurance and regulatory systems vastly inflate the price and quantity of health care above free market levels. I suspect that 1/2 to 2/3 of medical spending in the US is pure waste. That’s been true of most of the people I’ve known during my life (including me). And that’s what economic theory would predict given the massive tax/subsidy/regulatory distortions in our health care system.
READER COMMENTS
Avi
Feb 19 2020 at 3:07pm
He does the same calculations with AIC, which does include government spending on healthcare, and finds pretty much the same result.
Kevin Dick
Feb 19 2020 at 3:32pm
As Alex mentioned, RCA has written a small book over several posts. You should really read the book. Yours is an obvious criticism that he/she spends a fair amount of effort to address.
It may not convince you, but probably worth engaging the arguments RCA makes.
Fazal Majid
Feb 19 2020 at 3:45pm
US healthcare is more cartellized, starting with the AMA. A visit to a GP costs over $100 in the US, whereas it costs €25 in France, rated #1 for health care by the WHO.
Random Critical Analysis
Feb 19 2020 at 5:13pm
But they are, Scott! The independent variables I’ve used for my primary analyses here are Actual Individual Consumption (AIC) and Adjusted Household Disposable Income (AHDI). These measures were specifically designed to allow measurement invariant comparisons of real consumption and real income between countries with different types of economic arrangements. Social transfers in-kind, such as health or education, are factored back into both measures. In other words, it shouldn’t matter whether health care is paid for out of taxes (and providers in-kind) or paid for out of household’s disposable income to market providers. Both are regarded to be the best available measures of the material living conditions of residents (the household perspective).
Although my results indeed do not hinge on the exclusion of collective consumption, economic theorists have argued for its exclusion these sorts of indicators because it is mostly an intermediate (or defensive) input into generating the material welfare measures we observe in these measures. I’d argue such issues are likely to be more significant today since some economies are very much host to manufacturing, shipping, and tax-residence of multi-national corporations which, while they likely generate additional revenue for government and income for their residents (compensation), also demand extra services (police, courts, port security, etc.) that would not usually be required at the same scale. Collective consumption is probably even harder to price accurately. Although its inclusion weakens the predictive power of our dependent variable (as expected), it’s still evident not much would change for the US if we were to select final consumption over AIC.
My fundamental contention here is that GDP was never a direct measure for the thing we care about, i.e., the real resources (income) ultimately available to the residents of a country. This is much better indicated by AIC and AHDI. It’s no coincidence that basically every socially relevant variable you might choose to compare is better predicted by these measures than GDP and that these measures tend to fully mediate GDP and its subcomponents when GDP is disaggregated along different dimensions (sector and expenditure types). Similar results are obtained when GDP is disaggregated to predict health spending and various other characteristics.
Health care is consumption. It looks and acts like a luxury good at the national level. As residents of a country get richer, they consume more of ~everything in real terms, and health care is clearly no exception to this rule. The consumption basket of households and the relative prices they face also clearly moved systematically with the real household perspective, as in AIC or AHDI (they only move with GDP to the extent GDP predicts these measures). It’s apparent that richer countries invest much more in cutting edge health care (technological change) and that the cost per encounter (an indicator of the intensity of care) despite the fact that observable price levels cannot explain this. Even though a larger share of consumption is allocated to health care, consistent with our higher real income levels, it’s apparent we consume more of pretty much everything else in real terms.
In the main, the reason why real GDP and real AHDI are so much at odds with each other has to do overwhelmingly with (1) observable net primary and secondary income flows moving across borders and (2) rising savings of non-financial corporations (NFCs). Even in nominal (proportional) terms, these factors are clearly highly explanatory. There are also rather large differences in the price levels for consumption (AIC) and GDP — much of this likely follows from different weights that result from these different economies.
The United States combines both somewhat favorably from the point of view of households, whereas notable exceptions like Luxembourg and Ireland are massive outliers. These can be explained by, for example, sizeable cross-border workforce (~50% of Luxembourg’s workforce takes their paychecks back home to other countries with them regularly) and the outsize presence of foreign-owned affiliates, which likely inflate both primary income flows (dividends, rent, etc.) and savings in the NFC sector. The rise of NFC-related income flows and their savings is clearly of immense importance even when these few tax shelter countries are excluded from the analysis, so it’s worth specifically highlighting the fact that NFCs sectors’ disposable income (aka gross savings aka retained earnings) have ~0 incremental predictive value once the HH perspective has been accounted for.
I attribute this to the rise of globalization. Many presumably resident NFCs are owned by foreign corporations, and much of this behavior correlates quite strongly with foreign ownership rates. It’s also apparent this behavior (savings) is poorly explained by domestic capital investment activity, as most of this money is leaving the economies in the form of net lending. But regardless, even if there’s a perfect explanation for this run-up that’s wholly unrelated to tax avoidance motives and 100% of the equity of these corporations were owned by residents (presumably the ultimate beneficiaries in some distant future), I’d still say it’s highly relevant these expenditures aren’t showing up today in the HH sector in the economies hosting these NFCs and that their real purchasing power is much less than the average American.
Health spending is highly elastic, and households are spending today in proportion to the resources at their disposal today. It doesn’t matter if, say, Norway’s economy produces a bunch of extra potential income from oil if it’s been decided that they can’t spend it without risking economic catastrophe (once oil “dries up” or the price of oil collapses due to market volatility). I believe fiscal policy may have some small explanatory role for the United States relative to the typical OECD countries, insofar as real household disposable income would likely be (slightly) lower otherwise. Still, I submit (1) it has much, much more to do with the other issues I’ve mentioned (income flows, prices, etc.) and (2) the arrow of causation goes almost entirely from real disposable incomes to higher health spending.
Real GDP and real consumption have moved firmly together in the United States. In contrast, this connection has collapsed in several nominally high GDP countries (which have unusually significant effects in regressions on a highly elastic variable such as this!). The relative differences in the health spending in these countries have tracked robustly with the real HH perspective and generally not with real GDP. Except for Norway, these are poorly explained by government policy (collective consumption and/or fiscal policy). More generally, contrary to popular opinion, it’s evident the balance of trade and net lending differences in the OECD over the past decade or two are explained overwhelmingly by NFCs (the savings have been used for net lending across borders rather than capital investment activity) as opposed to HHs and/or the government sectors.
~ RCA
Scott Sumner
Feb 19 2020 at 9:10pm
Thanks for spending so much time answering my questions, but unfortunately I still don’t follow your argument. Health care spending does not primarily come out of disposable income, and hence I don’t understand why that variable is a useful way of explaining health care spending. I can see where GDP could have problems, and perhaps income earned by domestic residents would be better for places like Ireland. But that can’t explain the overall pattern on the GDP graph. In most places GDP does sort of measure relative per capita income.
You said:
“As residents of a country get richer, they consume more of ~everything in real terms, and health care is clearly no exception to this rule.”
But aren’t the Swiss richer, on average, than Americans? So why do they consume so much less health care? If you have a new way of measuring “richer”, in which the Swiss are far poorer than Americans, then I’m skeptical of that measure.
Kevin Dick
Feb 19 2020 at 11:15pm
Googling
“net adjusted household disposable income per capita switzerland”
and
“net adjusted household disposable income per capita usa”
produces ~37.5K for Switzerland and 45.3K for the USA.
RCA has addressed the question of whether AIC is useful in the post “Towards a general factor of consumption”
Scott Sumner
Feb 20 2020 at 11:21am
That just makes me really skeptical of “Net Adjusted Household Disposable Income”
In any case, they should not be using terms like “income” and “richer” in their explanations, if the variable they use produces such counterintuitive measures of income and wealth. Switzerland is a very rich country.
Random Critical Analysis
Feb 20 2020 at 12:16am
Thank you.
Yes, it does.
1) It’s mathematically included in the domestic (DPI), and international (AHDI) measures through its construction.
2) Conceptually it’s part of the (disposable) income of households. Who bears the incidence of employer-sponsored health insurance premiums? Who bears the incidence of taxation for Medicare and Medicaid? To whom to these benefits accrue or who is consuming the care? But for our high health spending, you’re presumably arguing, what? Would corporate profits be higher? Who else benefits but households (residents)? I submit the answer is overwhelmingly households (residents), not the government, not corporations (ultimately shareholders), and certainly not foreign investors. Although their disposable income wouldn’t change, they’d have more *discretionary* use of these resources but for the generous reimbursement policies offered by public and private payers.
3) The *prices* for health consumption also correlate with spatially with other consumption prices in ways that non-consumption does not seem to. In principle components analysis individual consumption expenditures (AIC) and their prices indices (PPP headings under of AIC) both from distinct components that are strongly linear with real disposable income and real AIC, unlike other GDP expenditure (Health expenditures and prices are part of this part component)
Besides the aforementioned theoretical arguments, it statistically explains a great deal. It mediates GDP and its components in multiple regression when health spending is the dependent variable and virtually nearly all other socially relevant variables you might care to examine. You might expect to find this sort of result by chance in a small handful of cases through chance, but when we get consistent results >99% of the time, you really should ask yourself *why* this is. If health care isn’t “coming out” out disposable income, as you argue, why does disposable income mediate GDP and its subcomponents when disaggregates? Shouldn’t we expect the opposite? Also, if this is just a fluke because of construction, why are similar patterns results obtained when health spending is (crudely) subtracted from disposable income? It’s the combination of multiples lines of evidence that I find most persuasive here, not any individual theory or single regression result.
Incidentally, in case you missed it, I’m not totally alone in referencing disposable income. None other than CMS has for years used DPI as the primary exogenous variable in their 10-year projection models.
http://www.cms.gov/Research-Statistics-Data-and-Systems/Statistics-Trends-and-Reports/NationalHealthExpendData/Downloads/ProjectionsMethodology.pdf
Name a better measure, and we can run something of a horse race. I don’t think the primary (market) incomes are a better fit conceptually, though. A few decades hence, when Norway’s oil rigs have ceased to generate significant revenues and their population is significantly living off the (passive) income flows from their sovereign wealth fund (i.e., transfers from government), do you imagine these resources won’t influence how households choose to allocate their consumption expenditures (including health care)? Due to the complexity of national accounts and the heterogeneity of the regimes in the OECD, I don’t think we can step that far away from (adjusted) disposable income conceptually before losing the ability to draw meaningful comparisons between countries (with state-owned enterprises, large government employment, etc.).
No, I don’t believe they are, not when it comes to their ability to consume within their own economy, i.e., spatial purchasing power. I mean, the *quantity* measures published by OECD.stat, WorldBank/ICP, and others indicate US households consume much more in real terms across most types of expenditures. And if we look at more direct measures, we find Americans have larger houses, more rooms, more appliances, more cars, computers, etc. We also seem to eat out more often, spend more per capita on higher ed, and much more — all behavior consistent with higher-income countries.
randomcriticalanalysis.com/2018/11/19/why-everything-you-know-about-healthcare-is-wrong-in-one-million-charts-a-response-to-noah-smith/#rcatoc-a-wide-variety-of-other-indicators-support-the-united-states-high-and-rising-indicated-material-living-standards
Switzerland’s household situation has been following a pattern of secular decline relative to the United States for the better part of 50 years now. Perhaps in 1970, this *material* picture would have looked different, but that’s unlikely to be the case today.
twitter.com/RCAFDM/status/1228412837350998016
They might have better luck when traveling or purchasing certain tradable goods due to differences in the exchange rate, but I don’t think this has nearly as much to do with the sort of mass affluence we’re ultimately concerned with here.
I didn’t invent these measures, and they hold up well empirically.
http://www.oecdbetterlifeindex.org/topics/income/
Please note, however, that *material* concerns of this sort are distinct from general claims of superiority. There’s more to “quality of life” than income or consumption alone. Higher incomes can buy a lot of things, but not everything. There are likely endogenous factors (e.g., culture, natural beauty, etc.) and some policy tradeoffs here (more hours worked per year, less unionization, etc.), but these don’t necessarily have much bearing on the *material* questions we’re ultimately interested in here. Insofar as I’m concerned, it’s very possible for Switzerland to be an overall more pleasant place to live due to its culture and amenities (at least for some people) while the United States is still richer in the ways I’m talking about (as in, where American households can spend a smaller fraction of their income of the basic necessities of life and still have more to spend on “luxuries” like health care, higher-amenity higher-ed, and restaurants/hotel consumption.)
randomcriticalanalysis.com/why-conventional-wisdom-on-health-care-is-wrong-a-primer/#rcatoc-rising-productivity-has-consequences-we-aint-gonna-starve
Scott Sumner
Feb 20 2020 at 11:54am
On your first point, if health care is included in your measure of disposable income then my response is that “disposable income” is a bad way to define your term. You are going to needlessly confuse readers, who already have in their mind a concept of disposable income. Have you considered a different term, like consumption, rather than disposable income?
You said:
“The *prices* for health consumption also correlate with spatially with other consumption prices in ways that non-consumption does not seem to.”
This surprises me. When I travel in Europe, consumption prices seem similar or higher than in the US. But I’m told health care prices are much lower in Europe. Is that wrong? Isn’t the relative wage of doctors higher in the US than Europe, even compared to countries like Germany where overall wages are pretty similar to the US? Ditto for drugs?
On Switzerland, even the PPP adjustments show they are about 10% richer. So this puzzles me:
“Switzerland to be an overall more pleasant place to live due to its culture and amenities (at least for some people) while the United States is still richer in the ways I’m talking about (as in, where American households can spend a smaller fraction of their income of the basic necessities of life”
How does a country 10% richer (Switzerland), even accounting for price differences, have less to spend on necessities? And not just a little bit less, but enough less to explain health care being 12.2% of GDP vs. 17.1% in the US? You may be right, but I’ve having trouble seeing where this Swiss poverty is coming from. Is the PPP measure wrong? Is it the different current account balances? It’s not taxes, as Swiss taxes are also low. Swiss investment as a share of GDP (22.2%) is not that much higher than the US (20.5%).
Wouldn’t Switzerland have to be as poor as West Virginia or Mississippi to make your numbers work?
I’ve travelled extensively in Canada. It seems a bit poorer than the US, but enough to explain health care being only 10.5% of GDP in Canada? What’s health care spending in West Virginia or Mississippi, as a share of West Virginia’s GDP, or Mississippi’s GDP? I’d guess still really high, but they are poor places, poorer than Canada.
A final point about living standard comparisons. Your point about big American houses and Swiss intangibles makes some sense. But once you move beyond money income comparisons then you are in a world of pure subjectivity. Economists have never come up with any objective way of dealing with cost of living differences when consumptions bundles are qualitatively different. It’s all guesswork. I assure you that the Swiss would view West Virginia as poor. Whether West Virginians would like Switzerland’s lifestyle is a harder question to answer.
Random Critical Analysis
Feb 20 2020 at 5:16pm
> if health care is included in your measure of disposable income then my response is that “disposable income” is a bad way to define your term.
Perhaps I am misunderstanding your argument here, but it seems like you’re trying to have it both ways??
(1) Resources spent on health care are resources that, in all likelihood, would otherwise end up in the comprehensive disposable income of households, if they wanted to make those tradeoffs.
(2) Health care is *also* included in GDP in much the same fashion, but few seem to struggle with this concept.
(3) The price of health care is reflected in the PPPs and weighted accordingly.
(4) The fundamental conclusion that the HH perspective (AIC or AHDI) dominates does not change even when health expenditures are arbitrarily subtracted from the independent variable.
(5) The difference is the disposable income of the corporate (gross savings), and government (collective consumption + gross savings) sectors are *also* included (which also affect the apparent price level). The systematic differences between these perspectives can mostly be attributed to (observable) net incomes crossing borders and savings in the non-financial sector (probably with some role for its effect on the GDP PPP basket weights).
What’s the argument for any of these other components of GDP to independently predict consumption decisions? If our GDP doubles but our real HH income levels and relative prices otherwise stay the same, why should we expect the share of income allocated towards health to change systematically in either direction (especially when it’s very likely these resources aren’t even ultimately owned by residents)? I’ve looked at this question empirically, and all evidence suggests these other flows have ~0 incremental informational value. At the same time, the elasticity on the HH perspective is very high (and it’s not like collinearity is a real threat when they’re disaggregated like this!)
> When I travel in Europe, consumption prices seem similar or higher than in the US
Of course, by definition, the relationship between the prices households are exposed to, and the nominal incomes of our residents are why our real household incomes are so high — Americans writ large have a level of mass affluence well beyond the reach of most of Europe today. My original point here was that as the real household perspective changes (AIC or AHDI), the consumption shares evolve systematically with it along with the *relative* prices households face.
I honestly believe so much confusion arises because people don’t understand this fundamental point–health spending is not unique in this! Indeed, if these sorts of patterns did *not* exist, i.e., if the relative prices and consumption shares moved substantially at random with real income levels, it’d be tough to compare living conditions even amongst countries of the same “real” income levels. This is part of the reason why relying on GDP in an increasingly globalized world can be so misleading since GDP expenditure basket has a lot of other components that don’t move the same, especially when there are some external/global factors skewing it in a particular direction.
For example, if we take all of the quantities per capita from OECD’s PPP benchmark (food, housing, restaurants/hotels, personal vehicles, etc.) corresponding to AIC, standardize each vector, and run this data through PCA, the first component (50% of the variance explained) is nearly perfectly correlated with real AIC per capita.
tinyurl.com/scaled-pca-vs-aic
Even if we exclude health, education, and transport expenditures (quantities), things people might believe to be idiosyncratically American, we still find this correlates robustly with AIC (r^2 of .95) and that America is pretty close to the trend.
tinyurl.com/pca-aic-excluding-health-etc
Conversely, if we attempt this same regression on GDP, we find (1) a much weaker relationship and (2) US residual is ++ while these high GDP comparatives are –.
tinyurl.com/pca-gdp-excluding-health-etc
Virtually all quantities of household consumption are better correlated with the real HH perspective (AIC and AHDI) than real GDP. This does not hinge on health care, education, or what have you. Despite allocating a larger share of consumption to health care, American households still manage to consume appreciably larger quantities per capita across most categories than the Swiss or other nominally high GDP countries.
> How does a country 10% richer (Switzerland), even accounting for price differences, have less to spend on necessities?
Their real GDP may a little higher, but their real HH disposable income and consumption levels more than 20% less than the US today. This can be explained by differences in the cross border income flows (think GNI) and by the relative size of the corporate sector, combined with the differences in the price level between AIC and GDP. It’s a stable result, not a one-off result for a single observation year, and this gap has only widened over the decades (which, incidentally, roughly parallels their relative decline in GDP). It is backed up by microdata as well.
> And not just a little bit less, but enough less to explain health care being 12.2% of GDP vs. 17.1% in the US?
The income elasticity of health expenditure from the household perspective is around 1.8. A ~20% increase in the real income of households translates into a ~36% increase in health spending. Switzerland’s relative health spending has tracked exceptionally well with their relative HH income levels.
twitter.com/RCAFDM/status/1228409070895366147
Their real GDP jumped around 2005, but their health spending didn’t follow (consistent with my arguments). These health expenditures are coming out of HH disposable income, and the remaining components of GDP have ~0 incremental predictive power, so the GDP share is mostly irrelevant for this application.
Scott Sumner
Feb 21 2020 at 3:08pm
RCA, Thanks for the replies. You said:
“1) Resources spent on health care are resources that, in all likelihood, would otherwise end up in the comprehensive disposable income of households, if they wanted to make those tradeoffs.”
Yes, but that’s not what disposable income means. Resources spent on the military would otherwise end up as part of disposable income, but no one would claim military spending is a part of disposable income. Disposable income is income after taxes, and hence tax financed public consumption is not a part of disposable income.
You said:
“Their real GDP may a little higher, but their real HH disposable income and consumption levels more than 20% less than the US today. This can be explained by differences in the cross border income flows (think GNI)”
You may be right but I’m having trouble with the intuition here. I’m pretty sure the Swiss own lots of foreign assets and have a big net inflow of income from overseas investments. So doesn’t that mean Swiss GDP actually understates their income (i.e. their GNP?) On the other hand, the big Swiss current account surplus does support your argument, as it lower Swiss consumption as a share of GDP.
Random Critical Analysis
Feb 21 2020 at 5:33pm
Thank you for taking the time to respond.
I disagree, as do many economic theorists (see thread below)
You might think so, but the rationale for excluding collective consumption of this sort is that it’s defensive expenditure. But for this spending we’d ultimately be poorer without the ability to defend our interests, police our society, etc– it’s an intermediate input into the real income we’re observing at the individual level. That we’re spending the resources there, and thus reducing our disposable incomes is informative, I think, as its utility is at best indirect. Now it might be true that, say, the United States spends more on national defense than it actually needs to, and that we could raise our disposable incomes higher still (!!), but there are always edge cases with the design of any framework of this sort, and I happen to believe this call is much more right than wrong.
It’s also worth noting that (1) collective consumption and government disposable income (in the sectoral approach) have ~0 independent predictive power for health spending (amongst other indicators) and (2) the results for the United States do not hinge on this as we also have high collective consumption. US real final consumption is also much higher than in these other high GDP countries. As I’ve been saying all along, the divergence between AHDI and GDP can mostly be explained with observed income flows across borders and the proportion of the NFC sector’s retained earnings as a share of GDP (collective consumption, government savings, the financial sectors gross savings cannot explain much).
tinyurl.com/hh-decomp-by-gdp
No, not in the way you think about this. These “disposable” income measures tend to reflect government transfers as *income* — the taxes we pay for these transfers and services effectively get netted out at the national level. US disposable personal income (DPI in NIPA) very much includes Social Security, Medicare, Medicaid, Unemployment benefits, veterans benefits, and more.
Further, when we want to compare the disposable income levels across countries, we need a measure that allows us to make measurement invariant comparisons, which is what SNA 2008 allows us to do with Adjusted Household Disposable Income (and Actual Individual Consumption for household consumption). Think about it. If two countries have the same real market incomes available to residents, but country A taxes itself 15% to pay for health and education whereas country B spends the same amount of these services but does it entirely privately (after taxes) with the same output, why on earth would you say that country A is 15% poorer?
I mean, even if you want to call what think of as disposable income “disposable income” (I’m not too hung up on the semantics of this), there are pragmatic reasons to prefer a uniform measure of the resources available to households, which includes cash/near-cash transfers and social transfers in-kind. This measure is called Adjusted Household Disposable Income
I’ll probably post something on my blog later that addresses why and how high GDP countries diverge wherein I’ll decompose it and show its correlates (I started a very long post on these thornier issues ages ago….). However, it’s quite obvious that American households are, on average, substantially richer than Swiss households when considering their consumption, disposable income, and other indicators of this (e.g., specific quantities across consumption categories). This is also supported by various microdata and count-type measures (we’re not entirely at the whim of National Accounts and PPP adjustments…though I think they’re very convincing when disaggregated in OECD’s PPP benchmark surveys)
The relevant issue here, insofar as I’m concerned, is what Swiss households actually own.
data.oecd.org/chart/5QBL
It seems that a substantially larger than average fraction of corporate equity in Switzerland is owned by foreigners.
tinyurl.com/foreign-shares
and that their HH and governments own less than average.
tinyurl.com/hh-and-gov-share-equity
Likewise, according to National Accounts, US households have significantly more financial net worth than Swiss households, especially when valued at PPPs. (You may notice that some of these nominally high GDP per capita countries don’t fare so well from the HH wealth perspective either despite having high corporate GVA)
tinyurl.com/animation-hh-finwealth-vs-CGVA
(The HH wealth picture is murkier when non-financial assets are included, but these only includes housing as non-financial assets, which probably isn’t very well measured, and likely reflects real estate prices to a large degree — very much a two-edged sword since it’s also a driver of the cost of living)
Scott Sumner
Feb 22 2020 at 1:34pm
Thanks, I don’t have the time to delve as deeply into this as you do, so I’ll keep an open mind. Right now I think the US might be a major outlier, might be a minor outlier, or might not be an outlier at all, as you suggest. I just don’t know.
Let’s step away from consumption, and think about production for a moment. Are these facts wrong:
Switzerland produces slightly more than the US (PPP)
All produced goods are consumer goods or investment goods, whether produced by the public or private sector.
Switzerland produces a slightly higher share of investment goods (22.2%) than the US (20.5%) .
Combining facts #1 and #3, Switzerland produces about the same absolute amount of consumption goods per capita as the US.
If I am correct about production, you still might be right, but it would have to be driven by international flows, right? But trade imbalances don’t seem big enough to produce that sort of gap (12.5% vs. 17.1% of GDP.) Furthermore, if it’s trade gaps, it’s not really a question of richer American deciding to buy more health care, it’s more like equally rich American deciding to live beyond our means, while the equally rich Swiss save a lot. Is that it?
It would help me if you could point out whether my assumptions about 1-4 are wrong, or if they are right, then if the preceding paragraph gets at the essential difference. I focus on Switzerland, but the same issues would come up with slightly poorer countries like Netherlands.
I’m also surprised that the Swiss have less wealth than we do, as the country saves a lot, and has high nominal incomes (useful in buying global stocks.) On the other hand, US stocks have outperformed, but US stock ownership is skewed toward the rich. Gates and Bezos having $200 billion between them doesn’t impact health care spending very much.
One other question. Why don’t you find rich East Asian countries to be outliers on the low side? Singapore’s PPP GDP clearly overstates their income, but surely not enough to explain a 4.5% spending ratio on heath care? That’s really low!
Random Critical Analysis
Feb 23 2020 at 7:19pm
Assuming there’s no profit shifting (or other monkey business) driving up apparent GVA (or vice versa) and assuming the PPPs for GDP is correct, sure, OK. I don’t dispute Switzerland’s real GDP per capita is slightly higher than ours today (~8%), but (1) it’s been declining relative to the United States since at least 1970 (2) it only recently regained its lead (and seems to be trending back down) and (3) there is some evidence that profit shifting is a real issue there.
rpubs.com/random_critical_analysis/che_vs_usa_real_terms
I think you’re coming at this the wrong way. We are concerned with income here, not production, and we are mainly worried about the (disposable) income available to resident households. The goods produced domestically on a GVA weighted basis are not necessarily what’s used by resident sectors (consumption or investment) because goods are imported and exported. Further, the national disposable income can be significantly greater than or less than GDP due to net income flows across borders. The more significant issue here is simply that these are significant sources of variance between countries — when the proportions of these cross border flows and the gross savings of the NFC vary substantially, this has predictable effects on the income available to resident households.
I don’t believe this is necessarily a useful framing, but Switzerland consumes less as a share of GDP. In 2017, the AIC share of GDP was ~74% to Switzerland’s ~60%, while US collective consumption was ~8% to Switzerland’s ~6%. The difference in these shares is even more substantial in real terms because the relative price of consumption to GDP is even lower in the United States. Switzerland’s real AIC and real collective consumption per capita were ~26% and ~29% less than the United States in 2017. Switzerland’s “real” GDP is heavily weighted towards gross fixed capital formation and net exports.
randomcriticalanalysis.com/wp-content/uploads/2020/02/us_vs_che_real_comparison_for_sumner.png
I’d say mostly international flows (net primary and secondary incomes) plus higher retained earnings in their resident corporate sector (which appears to be heavily foreign-owned).
rpubs.com/random_critical_analysis/hh_share_gdp_by_income_flows_and_nfc_savings
I should probably check the results for Switzerland specifically. Still, data suggests the excess savings in the resident NFC sector is being used for net lending (instead of significantly higher investment), which, I’m sure you know, corresponds theoretically and statistically with trade imbalances (in spite of some statistical discrepancies due to differences in accounting systems).
Because of the difference between production at the domestic level and income at the household level, which varies substantially as a result of international income flows and the allocation of income between resident sectors, I wouldn’t assume trade imbalances necessarily correspond to fiscal behaviors, especially in the combined household and government sectors. Swiss households seem to save a somewhat larger share of their income, but the results are approximately the same from the HH income perspective.
rpubs.com/random_critical_analysis/aic_vs_ahdi_2015
The picture is pretty similar when we add the disposable income of government (i.e., savings in the government sector plus collective consumption) to HH incomes.
rpubs.com/random_critical_analysis/aic_vs_HH_and_GOV_income
I believe the government fiscal policy probably contributes something here. Still, mathematically and statistically, it appears to have limited explanatory power for the US specifically, and for the OECD in general (excluding mostly Norway with its temporary income flows/consumption smoothing behavior). This is mostly about cross border income flows (dividends, rent, remittances, etc.) and savings in the non-financial corporate sector. The assumption that production within domestic boundaries (GDP) maps 1:1 or even consistently with the income available to resident households (the population of a country) is increasingly an untenable position. The differences are also likely to drive a wedge between the price level of GDP and the price level of the consumer’s comprehensive consumption basket (the price level of capital goods, for example, can drive down the relative price of GDP without corresponding effects being found in consumption prices)
Even if, for the sake of argument, your hunch were correct that is about fiscal responsibility, my central case here is that our high spending has approximately nothing to do with the distinctive characteristics of our health system — it’s a product of the high-income levels available to households. Our expenditures in health care, as in other categories, are highly consistent with our disposable income levels, so the notion that health spending is somehow pushing our apparent income higher is improbable, and health spending has been shown by CMS to be highly elastic with respect to disposable income (DPI) in the long run. If our government reduced our household disposable incomes by running a more balanced budget, health spending would certainly fall by some amount, but the residual of health spending on disposable income would likely still be reasonably similar (i.e., it’d still be approximately zero in the long run)
Because they mostly appear to be within the usual range of variation conditional from the household perspective. For Japan and Korea, it’s obvious (lots of data), whereas, for the likes of Singapore and Taiwan, the data are more limited, but still generally consistent from what I can see.
At least as of ICP 2011, Singapore real AIC was much, much less than their real GDP would typically suggest and much less than the US. The GDP share can undoubtedly be explained almost entirely by the disconnect between these two measures.
twitter.com/RCAFDM/status/1209634794465677313
Between their status as a tax shelter and their mandatory savings, real final consumption vs. real GDP in PWT 9.1 yields a pretty similar picture for Singapore as of 2018 (though direct measures of the HH perspective would likely paint an even starker picture). Singapore and a few other outliers (mostly petro states and tax shelters) blow up the trend because they have lots of leverage.
rpubs.com/random_critical_analysis/pwt91_2017_gdp_vs_consumption
Keep in mind that when I’ve found GDP to have a coefficient of ~0, whereas well-measured HH perspective coefficient >> 1. GDP drives the denominator, but not the numerator. High GDP but middling HH income = particularly low health spending as a share of GDP, and the patterns are virtually identical for almost any other consumption item you might care to look at (save, perhaps, in a few tourist economies)
Frank Weiss
Feb 20 2020 at 4:43pm
Then why not simply use Gross National Product instead of Gross Domestic Product? Then the international flows problems disappear.
That an R-sq is higher with a different measure would not be a good argument.
Random Critical Analysis
Feb 21 2020 at 11:23am
That only addresses the observable primary income flows problem at the national level. Secondary income flows (e.g., remittances) are non-trivial in lower-to-middle income countries, and surely influence their health spending (if we’re trying to run regressions across economically diverse countries these issues add up!). We are also concerned with which sectors are the beneficiaries of these net primary and secondary flows. These flows only tell us about what we can observe in the current period.
The other major issue here is the disposable income (aka gross savings aka retained earnings) in the non-financial corporate sector. Foreign-owned affiliates are still counted as resident corporations for the purposes of calculating GNI, and these corporations are clearly holding onto a lot of cash (i.e., these savings are mostly not being invested in capital projects domestically and they are not being paid to residents of these countries). I do not think it is a safe assumption today in our increasingly globalized economy that the resident households of a country are the ultimate beneficiaries of these savings (consider the case of Apple and company in Ireland).
But even if we assume there were no systematic differences in ownership rates (we know otherwise), and that 100% of this behavior is in the ultimate interests of resident households (unlikely), the fact that these flows are retained in corporations means that they are not available to households to consume or save on their own account. Besides which, this may still tell us something about unique issues faced by the resident corporate sector that other countries do not face, whether it’s the industries their in, access to capital, or what have you. I happen to believe tax avoidance is a major motive for much of the systematic differences we observe between countries. That these differences have tended to grow with time also indicates this is something more than just a short term situation. Regardless, the income flows and relative sizes of the apparent corporate sectors also influence the PPPs since GDP is weighted accordingly whereas households face a different set of prices.
Above and beyond the theoretical arguments, which I discussed at length on my blog, I fundamentally disagree. These indicators don’t merely correlate better with health spending in a single observation year, they correlate better consistently, year after year, cross-sectionally and in virtually all countries time series. The larger the disconnect between the real HH perspective and real GDP, the greater the statistical power, the larger the difference in these relationships. Moreover, when we disaggregate the data the coefficient on the HH perspective variables (AHDI or AIC) is always very large (larger than GDP) and tends to entirely mediate the other components of GDP. As in, conditional on the real HH perspective (which obviously reflects employee compensation, dividends, etc and other flows from corporations globally to resident households), having a larger non-financial corporate does not tell us anything of note about how households spend on health care. This is telling us something important and it fits with the theoretical arguments, particularly when we find very similar patterns with just about every socially relevant variable we might care to inspect. (such as health outcomes, health inputs, quality of life measures, etc etc…. with some rare exceptions like the strength of the domestic labor market/employment rates)
BJH
Feb 19 2020 at 5:14pm
The x-axis here is consumption, not income, is my understanding. Other countries might have higher income, but because of the lower personal savings rate in the US and other factors, US actual individual consumption is (often?) higher.
I second the recommendation to check out RCA’s essays.
Random Critical Analysis
Feb 19 2020 at 5:34pm
> households are spending today in proportion to the resources at their disposal today
Other typos and errors aside, what I meant to say here is that the demand and willingness to pay follows from the world as households see it in the short-to-medium run. They are budgeting relative to the constraints they are facing in the near term. Households respond to the extent they can quite rapidly. In practice, there’s very little relationship between changes in income and changes in health spending within the same fiscal period (baring the rare major disruption to employment, as in the last recession) since these preferences must get filtered through several intermediaries (employers, payers, etc) and providers must respond to changes in reimbursement policy. Health spending is mostly a lagging indicator of the real income of households.
Random Critical Analysis
Feb 19 2020 at 5:46pm
Hmm it seems my original (long) comment got hung up in moderation (too many links?)….
Gordon
Feb 19 2020 at 7:14pm
It’s too bad that the second graph doesn’t include Singapore given that its per capita GDP is $90k adjusted by PPP while its healthcare spending is $4k also adjusted by PPP. It would be a significant outlier on the opposite side from the US. But then I’m guessing the organization that created the graph doesn’t care to display such an outlier when private spending accounts for 45% of the healthcare spending in Singapore.
Random Critical Analysis
Feb 19 2020 at 7:58pm
Singapore’s health spending appears to be fairly well explained by their real household disposable income levels, although I wouldn’t be surprised if their semi-autocratic regime was somewhat more immune from democratic pressures for more generous health care benefits (which ultimately follow from the real incomes of households)
twitter.com/RCAFDM/status/1209634794465677313
data.worldbank.org/indicator/NE.CON.TOTL.ZS?end=2017&locations=SG-CN-IE-LU-DE-US-FR-CA&start=1975
Josh
Feb 19 2020 at 8:32pm
Scott, when two variables are tightly correlated you’re basically just left with 3 options: x causes y; y causes x; or z causes x and y (or that it’s spurious, but that seems unlikely given the strong correlation here).
In this case, either of the options are incredibly interesting. It means that this measure of disposable income and health spending are both being driven by the same process at the national level.
So it seems like instead of questioning whether this is the “right” measure, you should be wondering why it predicts so much about health spending.
Scott Sumner
Feb 20 2020 at 11:57am
Good point, but I see two issues here. One is the US, and one is all the rest. For most countries, his measure does correlate with income. It’s the US where the disposable income measure makes us look much richer than GDP per capita. And of course the US is the one country that is an outlier on spending, using GDP/person. So it may be a spurious correlation for the US, but roughly correct for the others.
Random Critical Analysis
Feb 21 2020 at 3:21pm
GDP is a measure of domestic production, full stop. It tells us useful things about the state of the domestic economy, and it’s probably a better indicator of the employment situation for residents (amongst other “economic” concerns), but it’s clearly not a direct measure of the income available to a country’s population (resident households). It’s a proxy for income, as most people, including economic theorists, would understand it, and an increasingly poor one at that.
1993 System of National Accounts:
2008 System of National Accounts
Report of the Commission on The Measurement of Economic Performance and Social Progress
####
No, not really, and it’s not that we’re “richer than GDP per capita”. Our real AHDI or real AIC is only slightly higher than typical countries conditional on real GDP on a per capita basis. However, there are enough peculiar countries, particularly a few small high GDP per capita countries with highly atypical economies (e.g., corporate tax avoidance, cross-border workforce, etc), to badly weaken the ability of GDP to be a reliable proxy for the real HH perspective when they are included. If you look closely, you’ll note that other large high GDP countries like Germany hew much more closely to the trend while Luxembourg, Ireland, Netherlands, and other small economies with known issues are often found significantly below trend (incidentally, it’s likely that some of these income flows from these countries are making their way back to the United States and helping boost our real income levels…. but we’re a much larger economy, so they have subtle effects)
tinyurl.com/us-is-much-less-the-outlier
These issues are particularly pronounced when you look at the global picture.
tinyurl.com/gdp-aic-global
There is no question whatsoever that the real HH indicators are vastly superior predictors of virtually all socially relevant variables you might care to inspect, and that GDP has virtually no independent predictive power once the HH perspective has been accounted for. Sure you can arbitrarily exclude some of these several dozen outliers, which can be a highly subjective exercise, and argue that GDP still sort of works as a proxy, but it’s still just a proxy, and it’s still an inferior one. It’s the exceptions the prove the rule here, and just because you remove the worst offenders does not mean you’ve actually entirely fixed the problem.
This is perfectly consistent with (1) the notion that health spending is highly elastic with respect to well-measured income (or consumption), as in, a 1.8% increase for every 1% in real AHDI and (2) these other countries being much more compressed in the real HH perspective than real GDP would indicate — this has been noted by OECD and others (and it’s clearly not just transient)
tinyurl.com/oecd-comments-on-income
Regardless, it’s very apparent that the real HH perspective is a robust predictor, which leaves very little to be explained, and that it mediates GDP. There’s really not a lot of mystery here.
rpubs.com/random_critical_analysis/income_and_health_spending_2015_includes_CHE
BC
Feb 20 2020 at 2:29am
“health care is provided by the government in many countries on the graphs above, not purchased out of disposable income. Where taxes are high, disposable income is often a smaller share of GDP than in the US.”
Isn’t that consistent with RCA’s story? When people have more disposable income, they can afford to buy more healthcare than the bare-bones, rationed, cost-controlled healthcare typically provided by government. So, for example, when Canadians can afford it, they often come to the US for healthcare to avoid long waits in Canada. If Canadian disposable income were higher, then more of them would be able to do that.
Suppose governments typically taxed people to provide each family with one standard-issue government car. Wouldn’t we still expect to see families/countries with higher disposable income spend more on cars? Those with higher disposable incomes would buy more and/or fancier cars.
Scott Sumner
Feb 20 2020 at 11:59am
US private spending on health care is many times higher than in Canada, but our income, however measured, is only modestly higher.
He’s trying to explain total spending, not private spending.
Alan Goldhammer
Feb 20 2020 at 8:02am
I’ve been a student of US healthcare issues for a lot of years (it was a minor part of my job remit when working in the pharma industry). Comparisons to foreign countries are difficult to make except at very global levels. In Europe there are several different approaches to providing universal coverage and those must be looked at separately. The Netherlands and Germany use regulated insurance approaches which is a dramatic difference from the UK NHS model.
Most Euro countries have national health records that are accessible by all caregivers. This is important in terms of reducing and/or eliminating duplicative testing which is quite frequent in the US (a good example is a US hospital visit where there is not access to recent test results done by a primary care physician and the hospital goes ahead and repeats the tests). Billing and coding costs in the US are much higher than in other countries.
Rx drugs are price controlled in virtually all ex-US countries (there is partial compensation on this point in the US with the wide availability of generic drugs at a much lower cost once patent exclusivity is ended) and medical charges are less as well. A far better way to look at this is medical cost per individual rather than as a function of disposable income. Even this is fraught with difficulty as we know people in the later stages of life generally incur higher medical costs than those who are younger.
I’m trying to make my way through RCA’s latest post which is somewhat heavy slogging for a non-economist. However, one can go back to Kenneth Arrow’s 1963 paper and still consider that we really have not made much progress in the intervening 55 years. There continues to be great discontent about the state of the US healthcare system on many fronts.
Random Critical Analysis
Feb 20 2020 at 9:09am
I have primarily approached this question from the perspective of the real cost per capita. However, at the national level, spending is overwhelmingly determined by the ability of households to pay in the long run (it takes several years to reach equilibrium because there are multiple intermediaries involved), and this is best indicated by the average real disposable income level (health spending is highly socialized in practice). Variables that predict health care costs within countries, such as age and health status, are empirically terrible predictors of aggregate spending between nations, likewise for countries’ long-run spending trajectories.
The differences we find at different units of analysis makes sense when you understand that (1) health care is a luxury good at the national level and (2) higher-income, higher-spending countries are primarily spending their money on higher-intensity medicine. Conditional on income levels, countries with an objectively higher need for health care (age, disease burden, etc.) or idiosyncratically higher prices are likely to balance spending out by spreading their resources a little more thinly, as in, using slightly less intensive medicine than they might otherwise. Generally speaking, however, the same sort of patient (age, sex, etc.) with the same kind of conditions (comorbidities) will, on average, be treated very differently in a higher-income country than in a lower-income country, and amongst most developed countries this has approximately nothing to do with his own individual income level (rank) within that country (save mostly to the extent it’s informative of individual health problems).
P Burgos
Feb 20 2020 at 9:11am
But given all of those inefficiencies, and the US’ high rates of obesity and low levels of daily physical activity, wouldn’t it be quite surprising that healthcare spending in the US wasn’t an outlier when plotted against a measure of household income? Maybe the US is actually consuming fewer services, procedures, tests and medications than would be predicted by its level of spending?
Something about the analysis doesn’t add up to me; other countries spend less on overhead, pay doctors and nurses quite a bit less than the US, and impose price controls on pharmaceuticals and other medical supplies. So I don’t see how it is that folks in the US aren’t getting much less bang for their buck in healthcare spending, and given that healthcare spending is roughly a fifth of US GDP, you would need to dramatically revise PPP to include the inefficiencies of the US healthcare system, which would make US households look much poorer relative to other developed countries than current PPP adjustments do. So the US would be an outlier.
Market Fiscalist
Feb 20 2020 at 9:34am
Can I be the first to propose Nominal Net Adjusted Household Disposable Income Targeting?
BW
Feb 20 2020 at 8:40pm
Nominal Net Adjusted Household Disposable Income Level Targeting!
Michael Pettengill
Feb 20 2020 at 12:39pm
In what universe are cars and medical care paid for out of disposable income, other than say cosmetic surgery by models and actors?
Which employers will hire a person who requires the employer provide transportation from where he sleeps to the workplace and back?
Which employers will hire a person born with or suffering from an injury that causes epileptic events, collapse, weakness, etc?
A “free market” requires creative destruction. A kid born in a rural area without roads must be able to live off the land, even if born in the US. Given the widespread support for socialism, roads serve everyplace people are born in the US – government owned with the price to use the roads completely unrelated to the costs of roads: walking on roads is priced at zero, except where walking is prohibited. If the kid can’t survive living off the land, or walk to a job which pays enough to replace the production by labor with equal or greater goods for wages paid, the kid dies. Socialism kicks in to provide free transportation for kids born in the US, roads with public transit ferry them to schools which train them to fit into a market economy by socialist investment in personal capital: education.
Health care is likewise socialist in principle, with the price set by law to free, with the cost of free medical care a matter to be contested in court or legislatures. The US has rejected free market health care most specifically when Reagan was president, and he signed EMTALA because “conservatives value life” and reject death panels.
Conservatives who want “free market health” reject the death panel creative destruction of doctors and hospitals demanding payment before acting to prevent death, of bean counters deciding a person should be dumped outside the hospital to die, unless someone else provides free care, maybe the police jailing them for the crime of bring sick and poor. Jails/prisons provide socialist medical care where the price to the patient is zero no matter how high the cost.
Note, those with income too low to pay the price of a car when that’s the only way to get to work also end up in many cases getting living costs paid for in jail, the socialist solution to the crime of being too poor to be employable.
No matter what economists today argue, price does not equal cost does not equal value, if you reject death panels placing a value of zero on the life of the poor. Some large number of people, tens of millions, are valued more if dead because their organ can be sold, or they can be fed to farm animals – creative destruction.
Thomas Sewell
Feb 21 2020 at 9:09pm
In this one? You don’t think people make trade-offs between how nice of a car to buy (usually in the form of monthly payment size in the U.S.) and other things to spend their income on, such as how much to go out to eat?
Medical care is more complicated to see, because there are so many intermediaries created by government regulations and insurance schemes, but it’s still primarily consumption-based disposable income in that it’s not primarily paid for via mandatory taxes. Thus, most people have a choice in how much they spend, either directly or via insurance.
I suppose you’re unfamiliar with countries like India, where workers in technology parks are typically transported to and from their home to work via vans (they call them cabs, but they’re really just big vans) because most of them don’t own their own car? Or unfamiliar with central California, where many tech companies provide buses for their workers?
If workers already have a personal vehicle and/or a way to get to/from work easily, then sure, why would a company provide part of their compensation also providing that to them, but where they don’t, it’s obvious that companies will, because they do.
Lots, as long as you don’t price those individuals out of the labor market by forcing their labor to be sold at a minimum wage above what they could otherwise trade it for.
Roads in the U.S. are one of the worse examples of “free” costing a lot, which argues in the exact opposite direction of your point. There’s a reason more and more locations are moving back toward private toll roads to fund them and price them according to congestion/traffic levels.
Conservatives/free market advocates/etc… reject death panels when they are forced on people via the government. They accept the fact that not everyone will always be able to afford the same exact consumption in various areas, including health care, food, shoes, housing, and other “necessities” like that.
They’re also cognizant that people will both adjust their behavior for the lack of a forced government “safety net” as well as provide a private one where it’s reasonable to do so. As in many other areas, private voluntary charity works much better than government forced charity.
People are able to make their own trade-offs among different products and services, even critical life-sustaining ones like food. We do it already every day.
What’s unusual is taking an entire set of consumption choices and forcing everyone to follow the choices of the politicians and bureaucrats about how and how much to purchase, rather than letting individuals choose for themselves.
Alan Reynolds
Feb 21 2020 at 9:25am
GDP per capita is not a plausible proxy for purchasing power of households or individuals (the variable related to the income elasticity of demand). GDP is gross, for one thing, with estimated depreciation of capital accounting for a large and growing share. Nobody receives depreciation as income.
Julius Probst
Feb 21 2020 at 12:43pm
I do think that this OECD measure (http://www.oecdbetterlifeindex.org/topics/income/) is not good at all. Too many problems, PPP adjustments are usually always somewhat problematic, but this is not even the biggest issue.
Just googling:
Size of household in the US: 2.7
Switzerland: 2.2
Germany: 2
Yeah, fine. So US household disposable income is significantly higher, but they are also more people per househehold, the US household is 22% larger than the Swiss one and 35% larger than the German one. This is not captured in the analysis at all.
Or am I wrong?
Definitely siding with Scott here. The US remains an outlier. The household comparison can explain why the US scores so highly relative to Switzerland , which disappears on a per capita level -> better measure
Random Critical Analysis
Feb 22 2020 at 12:09pm
I’m not seeing an argument here.
Your alternative is, what, nominal income? You do realize, I trust, that essentially all regressions you’ll see on this topic involve some sort of PPP adjustments to income and health expenditure.
No, you misunderstand. Household is a term of art in this context (national accounts) to refer to sector of the economy, i.e, resident individuals (households) instead of corporations or government. It has nothing to do with the average household size per se. The real adjusted household disposable income is what we put in the numerator, but the denominator is still the population when we refer to this transaction a per capita basis.
Mike Sandifer
Feb 21 2020 at 11:19pm
Physicist econ blogger Jason Smith demolishes RCA’s claims:
https://informationtransfereconomics.blogspot.com/2020/02/leaning-over-backwards-health-care.html?m=1
And RCA is not exactly behaving scholarly on Twitter. Why don’t we have a name?
Christophe Biocca
Feb 22 2020 at 10:59am
Well this part is just wrong. If you have a basket of goods/services you can purchase, and their marginal utility decreases at different rates as you consume more, your spending on some of them will grow slower than your income, and your spending on others will grow faster. This isn’t a problem per se.
Random Critical Analysis
Feb 22 2020 at 11:52am
Nah, he said a bunch of petty, uncharitable things about me, and quibbled over my choice of health expenditure model. Even if he were objectively correct in this small area of genuine argument, which he truly is not (I’ll show why later), he effectively affirmed my position that our level of health spending is not the outlier many believe it to be. Whereas conventional wisdom holds that we spend ~50% more than we should, his preferred model implies ~10%, i.e., even his analysis indicates I’m much more right than wrong. Further, he didn’t even engage with my analysis of prices, utilization, intensity, input costs, and so on. If you’ve actually read my work closely, you’d know claims of “demolition” are patently silly.
Random Critical Analysis
Mar 3 2020 at 10:33am
My response
https://randomcriticalanalysis.com/2020/03/03/a-response-to-my-least-charitable-critics-on-health-care/
Comments are closed.