
Quickly, without looking, guess what has happened to the S&P 500 in the last 5 years.
Ok, now check to see how close your guess is. In the last 5 years, the S&P 500 has risen by 72.21%. Does that surprise you? It did me. That amounts to an annual growth rate of 11.5 percent (not inflation adjusted.) Since inflation was low for almost 4 of those 5 years, it’s still a healthy rate of return. The Consumer Price Index has risen by 17.3 percent over that time. That means that the S&P 500 index has risen, in real terms, by 46.8 percent over the last 5 years. That’s an annual growth rate, in real terms, of 8.0 percent. Not bad.
Confession: I should know, but don’t, whether the S&P 500 is based on reinvesting all dividends. If it is, then end of story. If it is not (and I suspect that it’s not), the rates of return are even higher.
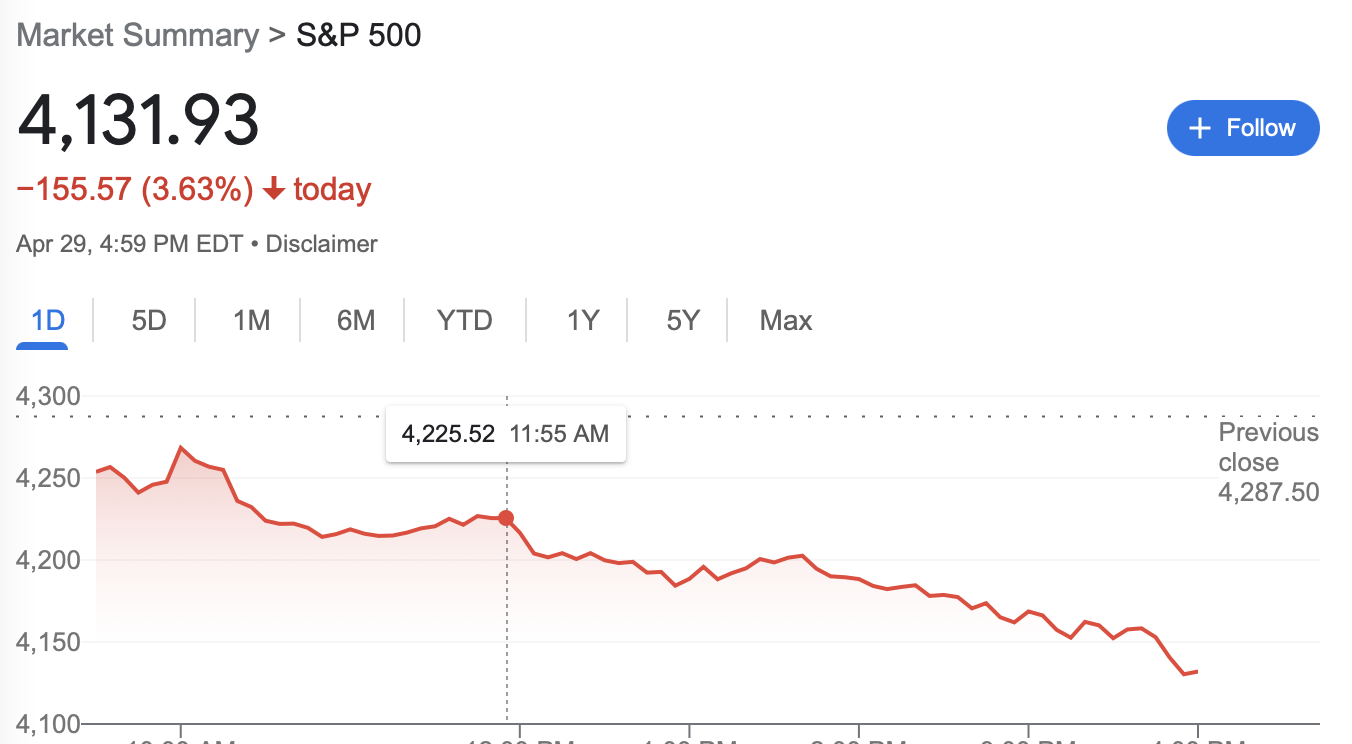
Why do things look so bad now? Because April and, indeed, the first 4 months of 2022, have been horrible for stocks. Since the start of the year, it has fallen by 13.86 percent.
But I learned decades ago, mainly by reading both the popular and the academic literature on finance, not to time the stock market. I’m in it for the long run. Former co-blogger Bryan Caplan learned that the hard way between March and June 2020. That one bad bet caused losses an order of magnitude larger than all his gains from all his explicit bets with individuals.
One of the most valuable articles published in David R. Henderson, ed., The Concise Encyclopedia of Economics is the one titled “Stock Market.” In it, author Jeremy Siegel, a finance professor at Wharton, shows that stocks have outperformed bonds, gold, and commodities by large margins over long periods.
READER COMMENTS
Loquitur Veritatem
Apr 29 2022 at 6:59pm
The S&P 500 index is a price index. It doesn’t include the effect of dividend reinvestment. For a reconstruction of that effect from 1871 to the present, see Robert Shiller’s data set: http://www.econ.yale.edu/~shiller/data/ie_data.xls
John Hall
Apr 29 2022 at 7:08pm
If you’re using values from Yahoo/Google Finance, then it is the S&P 500 price index, which does not re-invest dividends. You can also export historical data from Yahoo Finance that has an adjusted close that incorporates dividends. If you subscribe to it, you can get access to the S&P 500 total return index (I use providers like Factset and Bloomberg), but you can also see it here:
https://www.spglobal.com/spdji/en/indices/equity/sp-500/#overview
Just change the tab from price to total return.
Charlie
Apr 29 2022 at 7:50pm
An investment in the S&P 500 is actually up about 89% over the last 5 years. Look at the performance of a fund like Vanguard 500 Index Fund Admiral Shares (VFIAX).
James
Apr 30 2022 at 12:50am
If the EMH is correct, then timing the market badly is just as impossible as timing the market well. Any combination of the market portfolio and the risk free rate is on the efficient frontier. Whether you choose to time the market or not, you are only shifting between different allocations on the efficient frontier.
Jon
Apr 30 2022 at 5:33am
Not to get nit picky, but EFM says nothing about he efficient frontier but rather is an assumption of the efficient frontier as defined by Linter-Sharpe (which is now largely discredited and replaced by Fama-French’s 5 Factor Model for those not buying behavioral factors in explaining relative stock returns). As for market timing, Shiller shows that risk premium likely does change over time so allocation (not market timing using his CAPE ratio!) adjustments can make sense.
Finally, and most importantly, just because stocks have outperformed other asset classes doesn’t imply they always will. Just ask any Japanese investor from 1989 or better yet, an investor in pre-communist Russia or China.
Alejandro
Apr 30 2022 at 11:58pm
“The stock market is a device for transferring money from the impatient to the patient.”
Warren Buffett
Matthias
May 2 2022 at 3:40am
Strictly speaking, I don’t think the comment you replied to said anything about stocks?
It talked about the market portfolio.
The market portfolio includes stocks, but it also includes real estate, bonds, bank deposits, commodities etc.
Also the market portfolio encompasses the whole market. Your examples illustrate the folly of concentrating in one geography.
I’m a bit fuzzy on how investable things need to be to count as part of the market portfolio?
BC
Apr 30 2022 at 6:51am
On Yahoo Finance, the symbol for the S&P 500 Price Index is ^GSPC, which is probably the one your figure is from since the 4/29 close is 4131.93. The symbol for the S&P 500 Total Return Index, which includes dividends, is ^SP500TR, which closed at 8696.65. On Bloomberg, the corresponding symbols are “SPX Index” for price index and “SPTR Index” or “SPXT Index” for total return index.
David Henderson
Apr 30 2022 at 9:17am
Thanks, Loquitur, John, Charlie, and BC.
Alex
May 1 2022 at 11:17am
“The stock market is a device for transferring money from the impatient to the patient” Warren Buffett
Matthias
May 2 2022 at 3:44am
But that’s only because of transaction costs.
Comments are closed.