
During recent months, opinion has shifted toward the view that the economy might avoid a “hard landing” (i.e. recession) as the Fed tries to bring inflation back to 2%. I agree that a soft landing looks increasingly likely, but fear that too little attention is being paid to the risk of no landing at all.
Today’s jobs report showed unemployment falling to 3.5% while 187,000 new jobs were created. Some of the media commentary suggests that this was a soft report, as the payroll employment figures were lower than the recent pace of job growth, and lower than anticipated by forecasters. In fact, 187,000 new jobs is an extremely strong figure, evidence of a booming labor market.
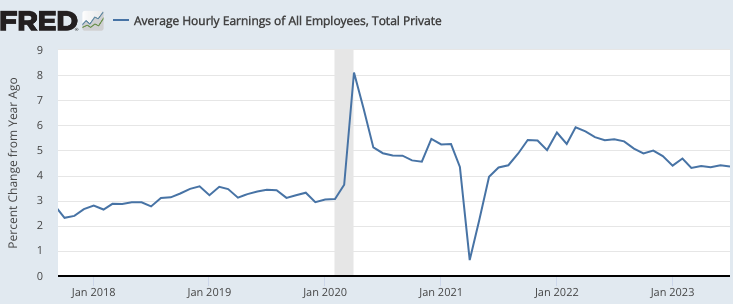
When it comes to evaluating the prospects for a soft landing, the growth in average hourly earnings is a far more important data point than jobs or unemployment. The 12-month growth rate fell from a peak of 5.9% in March 2022 to 4.4% in January 2023. It needs to fall to about 3%. Unfortunately, there has been no further progress toward that goal since January, as the 12-month growth rate remained at 4.4% in July:
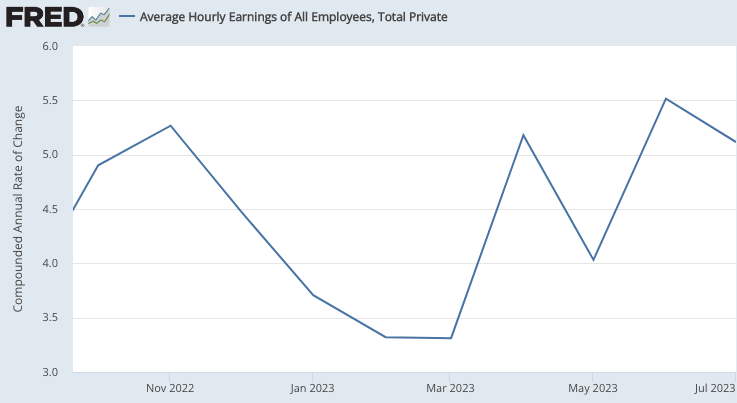
An examination of even more fine-grained data shows a slight recent uptick in monthly wage growth to nearly 5% over the past 4 months. That might just be noise in the data (wages are a lagging indicator), but it is an indication that we have yet to achieved the necessary slowdown in wage inflation required for a soft landing. Pundits keep asking why the inflation slowdown hasn’t yet been more painful. The answer is that wage inflation is still elevated, and it’s wage inflation that is painful to stop. The Fed’s tardiness in responding to the inflation problem will probably make the endgame more painful than necessary.
[Price inflation is of interest to shoppers, but plays no important role in business cycle theory. Jobs, nominal wage inflation and nominal GDP are the variables that truly matter. I talk about price inflation only because the Fed targets it. If price inflation has any use in economics, it is in guesstimating changes in long run living standards.]
Today, economists use the term “Phillips curve” to refer to the relationship between price inflation and real variables such as unemployment. There are two problems with this. First, the curve is misnamed, as Irving Fisher invented this model back in 1923. Second, the relationship that A.W.H. Phillips (pictured above) examined back in 1958 was between wage inflation and unemployment. That’s the correct relationship! It’s far more meaningful than the relationship between price inflation and unemployment (which is contaminated by supply shocks in sectors like food and energy.) The price inflation/unemployment graph should be called the Fisher curve, while the wage inflation/unemployment graph should be called the Phillips curve. Back in the 1960s, the economics profession made a big mistake when they replaced Phillips’s (wage) version with Fisher’s (price) version.
The negative relationship between wage inflation and unemployment occurs because nominal wages are sticky. Thus when the equilibrium nominal wage declines sharply (usually in a recession) the actual nominal wage falls more slowly. This means that during periods of falling wages, the equilibrium wage will fall faster than the actual wage, and the above equilibrium actual wage will cause elevated unemployment.
Of course this model also has flaws, as it fails to account for the impact of expectations. A soft landing is easier to achieve if workers expect slower growth in equilibrium wages, and hence are willing to settle for slower growth in actual wages. (Again, ignore price inflation—it plays no role here.)
PS. After writing this post, I saw that Larry Summers has similar concerns. I’m actually a bit less pessimistic than Summers. I believe all three possibilities (hard landing, soft landing, and no landing) are still in play. I still see soft landing as the most likely outcome, even if the odds are only 40% vs. 30% for each of the other two outcomes—say through calendar 2024.) In other words, my forecast is ¯\_(ツ)_/¯.
PPS. The graph below shows annualized one-month nominal wage growth rates:
READER COMMENTS
Andrew_FL
Aug 4 2023 at 3:58pm
By odd historical coincidence, 1955-1966 happened to be a period with an unusually stable statistical relationship between CPI inflation and unemployment. It sort of makes sense to adopt that model at that time. The really odd thing is the persistence of unemployment->price inflation theory in the face of, everything that happened after that.
Scott Sumner
Aug 4 2023 at 6:04pm
Good point. Lock-in effect?
spencer
Aug 4 2023 at 4:38pm
There is demand side inflation and there is supply side inflation.
We not only have demand side inflation (dis-savings), or a fall in the demand for money, but we also have supply-side inflation:
See: “The Great Demographic Reversal” by Charles Goodhart and Manoj Pradhan.
marcus nunes
Aug 4 2023 at 5:07pm
NGDP Advice-Marcus Nunes
@NGDP_Advice
1h
I think the prob. of “soft landing” higher than 40%. U is flattening and so is the wage/NGDP ratio. NGDP growth is just a whisker above “target”.
VL Elliott
Aug 5 2023 at 6:49am
Very helpful Dr. Summer.
Michael Sandifer
Aug 5 2023 at 10:57am
From the NGDP level targeting approach, if inflation does continue to come down and we have a soft landing, does this present a problem for the claim that we should put so much stock in NGDP being above trend? Does it, at the very least, raise questions about the baseline adopted using such an approach?
Scott Sumner
Aug 5 2023 at 1:16pm
No. I have a recent post on level targeting that explains why.
Thomas L Hutcheson
Aug 5 2023 at 9:19pm
Could you expand on why wage inflation should be the target. Do you mean a rule to target prices that are most sticky downward? But if the cost of inflation is people making mistakes in the long term contracts they sign or expectations of future relative prices, why would it not be important to target a broad spectrum of prices rather than wages?
Scott Sumner
Aug 7 2023 at 1:30am
I believe that stable nominal wage growth is likely to lead to a relatively stable labor market, due to the stickiness of nominal wages.
Travis Allison
Aug 7 2023 at 12:10am
Scott, when you say wages need to increase at 3%, are you implying you would like a 3.5% NGDPLT growth rate? (3% wage increase + 0.5% population growth)
Scott Sumner
Aug 7 2023 at 1:28am
Yes, I think a 3.5% (or slightly higher) NGDP growth rate would be fine.
Comments are closed.