I am a behavioral political economist. I think most political economy models are worthless. Unless you start with empirically sound assumptions about voter cognition and motivation, you’re wasting your time – and the time of everyone who reads you. What makes my stance especially stressful is that behavioral economists strangely neglect political economy. Most of the scholars with the tools to fix political economy are otherwise occupied.
Fortunately, thanks to noble exceptions, the intellectual climate is slowly improving. Case in point: Gimpelson and Treisman’s new NBER working paper on “Misperceiving Inequality.” The paper’s great from beginning to end, but here are some highlights.
Motivation:
What if the masses have little notion of how much wealth the elites have accumulated and whether the gap is growing or shrinking? What if even the rich cannot gauge how strong is the motive for the poor to revolt? In such cases, the neat link between actual inequality levels and political outcomes evaporates. The goal of this paper is to show that such uncertainty and misperception are ubiquitous. We present evidence from a number of large-scale, cross-national surveys that in recent years ordinary people have known little about the extent of income inequality in their societies, its rate and direction of change, and where they personally fit into the distribution. What they think they know is often wrong. This finding is robust to data sources, definitions, and measurement instruments. For instance, perceptions are no more accurate if we reinterpret them as being about wealth rather than income.
Fun self-referential argument:
A strange inconsistency underlies much recent scholarship. On the one hand, theories assume that individuals correctly perceive the income distribution. On the other hand, scholars complain that the data available to test these same theories–in developed democracies and, even more so, in poorer, less free societies–are “dubious” (Ahlquist and Wibbels 2012) and “massively unreliable” (Cramer 2005). Yet, if experts throw up their hands at the quality of the data, it is strange to assume the general public is better informed. And if analysts fault the figures available today–despite the most sophisticated statistical agencies the world has ever seen–data quality must have been much worse during the nineteenth century heyday of revolution and democratization.
Main conclusions:
The implications of this point for theories of redistribution, revolution, and democratization, are far reaching. If these are to be retained at all, they need to be reformulated as theories not about actual inequality but about the consequences of beliefs about it, with no assumption that the two coincide. We show that, although actual levels of inequality–as captured by the best current estimates–are not related to preferences for redistribution, perceived levels of inequality are… The actual poverty rate correlates only weakly with the reported degree of tension between rich and poor; but the perceived poverty rate is a strong predictor of such inter-class conflict.
Gimpelson and Treisman heavily rely on the ISSP survey, which showed respondents around the world five different income distributions, then asked them which one best-described their own country. Results:
Respondents turn out to be wrong about their country’s income distribution most of the time. Worldwide, 29 percent of respondents chose the “correct” diagram if we refer to their country’s post-tax-and transfer Gini and 24 percent got it right if we use the pre-tax-and-transfer measure. For reference, a purely random choice among the five possible answers would get the answer right 22.5 percent of the time for post-tax-and-transfer incomes and 20 percent of the time for pre-tax-and-transfer incomes.12 In other words, respondents worldwide were able to pick the “right” diagram only slightly more often than they would have done if choosing randomly.
[…]
Were most people at least close? To check this, we examined what proportion of respondents were within one diagram of the correct one (for instance, if the correct diagram was B, we measured how often the respondents picked A, B, or C). With only five options to choose between, getting within one place of the correct option is not a very difficult task. Picking randomly among the five diagrams, respondents should be within one place of the correct diagram 68 percent of the time if focusing on post-tax-and-transfer income and 43 percent of the time if focusing on pre-tax-and-transfer income. In fact, for post-tax-and-transfer income they were right 69 percent of the time, just one percentage point better than if they picked randomly.
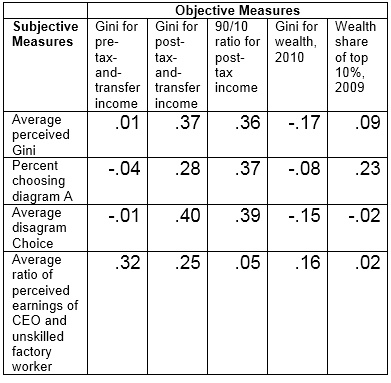
G&T have a neat table summarizing the flimsy correlations between real and perceived inequality. Since it’s hard to read, I’ve transcribed it:
G&T go on to show that people around the world imagine they’re near the median income. Few people think they’re poor, and almost no one thinks they’re rich. Only 1% of people who own a second home think they’re in the top decile of their country’s income distribution!
Owning two houses is usually a sign of wealth. In all 40 LiTS countries, at most one in four respondents said that his or her family owned a second residence, and in all but three countries the frequency was less than one in six. Yet most such property owners did not consider themselves especially rich. On average, 60 percent of the secondary residence owners placed themselves in the bottom half of the income distribution. In Uzbekistan, only three percent of respondents lived in households with a second residence, yet almost two thirds of these thought their incomes were below the national median. Such anomalies were somewhat rarer in the developed countries. Still, in France, Italy, and Great Britain, 40 percent or more of second residence owners placed themselves in their country’s bottom half.
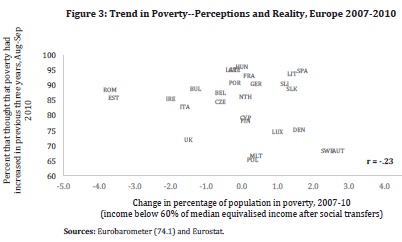
What about changes in inequality? Here, the correlation between reality and belief is actually negative.
The coolest part of the paper, though, are the regressions of support for redistribution on objective and subjective measures of inequality. As every shrewd politician suspects, perception crushes reality:
[N]either the pre-tax nor the post-tax actual income Ginis are positively related to support for redistribution at either the country or the individual level. However, perceived inequality is highly significant in both cases. In countries where inequality was generally thought to be high, more people supported government redistribution. But demand for redistribution bore no relation to the actual level of inequality. In fact, given the average belief about inequality, higher actual inequality was associated with lower demand for redistribution. Breaking down perceptions into their general and idiosyncratic components, we found a stronger effect of the general perception in the country than of the individual’s idiosyncratic perceptions. Still, both seemed to matter in the way expected.
The same goes for perceived class conflict:
At the country level, post-tax-and-transfer inequality was significantly associated with greater reported tension between classes, although pre-tax-and-transfer inequality was not (Table 10, panel A). However, the effect of actual inequality was dwarfed by that of perceived inequality, which was about three times larger. And the effect of actual inequality disappears if one controls for the country’s income and population (column 5).
“Misperceiving inequality” has another, unstated lesson about inequality. Namely: One paper that tests the connection between objective and subjective inequality is worth a thousand that take it for granted. Read the whole thing.
READER COMMENTS
Cole
May 28 2015 at 12:33am
Brian, I am sure I have read or heard you talk about this before.
But my impression at the time was that you didn’t claim to have solid evidence, but you would have guessed or bet that this is what the study would have found. It would be cool if you had a link to an earlier prediction of this result.
Either way I’ve tested this idea out on liberals with some knowledge of inequality arguments (think undergraduate degree, not PhD). They generally seemed offended at the idea that it might be best to hide information from an electorate even if it made the electorate happier.
MikeP
May 28 2015 at 5:51am
Given that most people have little intuition for either random or nonlinear effects and are rationally disinterested in almost everything, how much of this is an artifact of the fact that people turn out to be wrong about any distribution most of the time.
It doesn’t change the results or their importance, but the apparent biases are likely purely accidental.
Matt H
May 28 2015 at 8:02am
So how does letting in lots of poor people, who end up creating favelas in central park affect the perception of inequality?
Seth
May 28 2015 at 10:27am
What would also be interesting is how perceptions of ‘inequality’ encourage people to take it upon themselves to improve their lot in life.
It seems like these questions are asked assuming fixed pie and the only path for change for individuals is diktat.
Tiago
May 28 2015 at 11:00am
“A strange inconsistency underlies much recent scholarship. On the one hand, theories assume that individuals correctly perceive the income distribution. On the other hand, scholars complain that the data available to test these same theories–in developed democracies and, even more so, in poorer, less free societies–are “dubious” (Ahlquist and Wibbels 2012) and “massively unreliable” (Cramer 2005). Yet, if experts throw up their hands at the quality of the data, it is strange to assume the general public is better informed. And if analysts fault the figures available today–despite the most sophisticated statistical agencies the world has ever seen–data quality must have been much worse during the nineteenth century heyday of revolution and democratization.”
This is the kind of brilliant argument which makes you go “how was this not obvious to everyone before he had to point that out?”
Robert Schadler
May 28 2015 at 11:10am
The poor (and others) may well misperceive the income distribution of their societies and where they fit on it.
But they may also realize (what few economists and journalists seem to) that overall economic “well-being” is a combination of income, wealth and access to (or consumption of) goods and services. Most children and some retirees have no income; some have great wealth; almost all have access to food, shelter, clothing. An adult child of someone of great wealth may live life far more luxuriously than someone with a good income. And many of the poor have access to some goods, whether family or welfare state benefits.
So, even if, perception coincided perfectly with reality regarding income, it would, at best be partial and, as partial, often misleading.
AS
May 28 2015 at 11:40am
@Robert Shadler: I agree with that idea. Numbers like income and wealth are just abstractions over reality. What matters is real consumption. Better questions would ask about access to real goods and services such as health, medicine, shelter, education, information, etc.
Nathan W
May 28 2015 at 2:29pm
@AS
Indeed, work on poverty and inequality is very much trending towards consumption based measured of wellbeing rather than income based measures of wellbeing. Income data just happens to be more available than consumption data, so many researchers focus on monetary measures of wellbeing.
IVV
May 28 2015 at 3:47pm
@Seth:
“What would also be interesting is how perceptions of ‘inequality’ encourage people to take it upon themselves to improve their lot in life.”
I imagine it’s similar to the number of people willing to say, “I’m poor, and I deserve it!”
Precious few people I know use inequality perceptions to get themselves up in the morning to do a good job. In fact, I think it’s likely no one. Other reasons, yes, but not inequality perceptions.
Jon
May 28 2015 at 9:19pm
What’s interesting is there’s not much hint of the type of error the population is ordinarily prone to based on what Brian wrote. Do they think it’s worse than it really is or do they think it’s better than it really is? As an apologist for the rich I wouldn’t expect Brian to make it clear that it’s worse than people realize. That’s not something the rich want people to recognize. Fox News would never talk about that either. But it’s true.
Brian does imply that things are not as bad as perceived with his change in poverty graph. That’s the story the rich like to hear told. If in fact the rich are gobbling up the wealth and leaving little for the rest, they would prefer the public not know this. Otherwise the public may resist.
What this is saying is that the major media, owned by the super wealthy and selling a product (audiences) to the super wealthy (advertisers) is good at looking out for the interests of the wealthy. Inequality is much worse than people recognize, but the media has obscured it, like they’ve obscured the debate on global warming, which naturally the Koch brothers and BP prefer to be obscured.
I think Brian’s take away is that this is all the more reason why democracy is terrible and should be undermined. People are stupid, so they must be ruled by educated people like himself, people that are so smart they’ve imposed Chicago style free markets on places like the former Soviet states, Latin America, Africa, and turned those places into hell holes, but made investors very rich, and created the inequality that media, likewise pushing the agenda of the rich, has successfully obscured from the public. Fortunately democratic action has countered the propaganda efforts of the rich and people are at least more aware of the extent of inequality than they were before. Occupy did make some inroads. But there’s still a gap in that knowledge, a gap I think people like Brian have contributed to creating.
James
May 28 2015 at 11:51pm
Jon,
Did you ever consider that income inequality is distracting you from even more severe forms of inequality such as inequality of spending? In the US last year, federal spending, about 20% of all spending, was controlled by the 536 people in Congress and the Whitehouse. This is far more severe than any estimate of income inequality. Shouldn’t this be the bigger priority for people concerned with inequality?
Jon
May 29 2015 at 8:04am
James, government spending isn’t as bad theoretically because we’re supposed to be a democracy. They’re spending what we, as a society, have deemed to be important. In a democratic society tax day would be like a day of celebration. It’s the day we get together and pool our resources to do the things that we, collectively, think are important.
But people recognize that really we aren’t a democracy, and that’s why tax day is really a day of mourning. It’s like this alien force takes our money and spends it in a way we don’t like.
So the money is spent on oil subsidies. Let’s call on the taxpayer to shovel money into the pockets of investors. This accelerates the environmental destruction. Not what people want democratically, but for Brian people are idiots, we need to be ruled by elites who ignore the “roaring and trampling of the bewildered heard” or the “mob” as the people are referred to by the very elites who naturally feel they are best suited to rule.
More money for ISIS militants fighting Assad. Oh wait, now ISIS is a problem, we need more armaments to fight them. This is the government that ignores the people as Brian prefers and implements policies preferred by the specialized class of people who retain power by catering to the rich, not by appealing to ordinary people.
James
May 29 2015 at 10:21pm
Jon,
In this world, 536 people get to decide how to spend a few trillion dollars. Perhaps those 536 people could, in theory, only ignore the wishes of at most 49.9999% of the population. That doesn’t change the inequality of the situation as it exists now. For 536 people to decide how to spend trillions is a few orders of magnitude more unequal than incomes. So why do you focus on the smaller problem?
liberty
May 30 2015 at 4:52am
Nice post. Just a couple little quibbles.. You quote this:
“Owning two houses is usually a sign of wealth. In all 40 LiTS countries, at most one in four respondents said that his or her family owned a second residence, and in all but three countries the frequency was less than one in six. Yet most such property owners did not consider themselves especially rich. On average, 60 percent of the secondary residence owners placed themselves in the bottom half of the income distribution. In Uzbekistan, only three percent of respondents lived in households with a second residence, yet almost two thirds of these thought their incomes were below the national median. ….”
There is a strong assumption here, which is that everyone who can afford a second home will buy one (btw, are we assuming they are bought outright or fully paid off, or can they be heavily mortgaged?). It is quite possible that e.g., only one in five Americans purchase ESPN, own a Playstation, or go to the opera, but does this mean in each case that they are all in the top quintile (20%) of the income distribution? Just because only a fraction of people have something does not mean that only they can afford that thing. True, housing is more universally desired than most products, but it is only the first home that is truly distinct from other products and even it has the substitute called ‘renting’ which many people choose. Certainly some of the top quintile might choose an expensive car or regular skiing holidays and cabin rental instead of buying a second home… hence it may be that more than your e.g., top 10-20% can afford a second home, and so these 2nd home owners who thought they were below that line theoretically could be right.
You also quote this: “higher actual inequality was associated with lower demand for redistribution.”
Here you have a causation vs correlation issue, in that lower demand for redistribution may lead to higher actual inequality – especially post-tax-transfer, as you will tend to have lower transfers if people have a low demand for redistribution, assuming the people’s demand have some effect on policies
Dallas Weaver Ph.D.
May 30 2015 at 1:07pm
My Gini.
Looking at my income since I started filing 1040’s in 1958 to the present time, I calculated the Gini coefficient for that income stream (didn’t use an inflation correction that would decrease the coefficient by some).
My Gini is 0.70, showing huge inequality.
A population of citizens with this huge individual gini (far worse that the worse country in the world) would be defined as horrible, but my life has been good.
What makes my gini so high is directly related to poverty level incomes from 58 to 71, while was in school and avoiding the draft. Graduating at a time of a glut of physical scientist, I started out low but after a decade started my own highly volatile business with good and bad years.
The business ended when I sold the building (lucky – in 2005 before the crash), equipment and semi-retired. That gave a very good year in the top 1%. Giving a lifetime range from the bottom 1% to the top 1%. Even in the bottom 1% with three grad students in a shack with a $200 car and a big pot of beans and cheap jug wine was very good.
How much of the increasing Gini is from an increase in more volatile self-employment and more education with family defined by 1040’s?
What does it all actually mean?
Comments are closed.