
In the 21st century, macroeconomics is entering a new Dark Ages. We seem to be forgetting much of what we learned in the last half of the 20th century.
That judgment may be harsh, but if I’m wrong then you should no longer read anything I write (including the book I have coming out this year), because in that case I wouldn’t actually know anything useful about macroeconomics.
Perhaps the most firmly established proposition in late 20th century macroeconomics is that the Great Inflation of 1966-81 was caused by central banks printing too much money. If that proposition is wrong, then I might just as well give up. Everything else I believe about macro hinges on that being true. If the Great Inflation wasn’t caused by too much money, then what can macroeconomics tell us about the world?
1. Hockey sticks, wherever you look
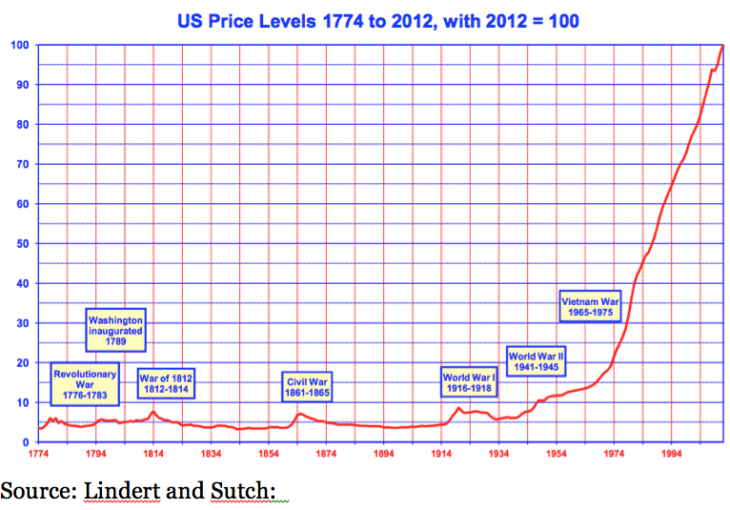
People often talk about “hockey stick” graphs. Deirdre McCloskey using that metaphor for the explosion in real incomes in recent centuries. Demographers use it for the Earth’s population. Environmentalists use it for carbon emissions. Tech people for gigabits of information. And there’s also a hockey stick graph for the US price level, as well as the price level of many other developed countries. The US price level was fairly flat during the first 150 years of US history, and then exploded upward 20-fold after 1933.
Back in 1752, this was all explained by David Hume. Out-of-sample forecasting is the gold standard of model success, and by that standard Hume might be the greatest macroeconomist of all time. Of course he didn’t use modern terminology like “nominal GDP”, but if you translate his core argument into modern lingo, it goes something like this (my words):
A large exogenous increase in the money supply will cause a roughly proportional increase in NGDP. There would not be a precise correlation, as velocity moves around as well. Because real growth is caused by non-monetary factors, excessive growth in money will simply lead to inflation, as NGDP growth outpaces RGDP growth.
During the first 150 years of US history, the monetary system was commodity based (bimetallic and then a gold standard.) That kept money growth close to the rate of growth in RGDP, and hence there was almost no long run inflation (although prices moved up and down erratically around a near-zero inflation trend line.)
Then we tried Hume’s experiment. After many decades of fixing the price of gold at $20.67/ounce, we let it rise sharply. Today it’s over $1800/oz. We used that freedom to print lots of money, and as the monetary base began rising much faster than RGDP, inflation also took off. The numbers were pretty much what Hume would have predicted. And most of the “anomalies” were explained during the 1950s, 1960s and 1970s by economists doing technical research into what caused shifts in money demand. The one thing Hume didn’t predict is the advent of interest on bank reserves in 2008, which caused the relationship between the money supply and inflation to weaken. But that wasn’t a factor during the Great Inflation.
2. The Great Forgetting
Doug Irwin directed me to a recent paper by Itamar Drechsler, Alexi Savov, and Philipp Schnabl on the Great Inflation. Here’s the abstract:
We propose and test a new explanation for the rise and fall of the Great Inflation, a defining event in macroeconomics. We argue that its rise was due to the imposition of binding deposit rate ceilings under the law known as Regulation Q, and that its fall was due to the removal of these ceilings once the law was repealed. Deposits were the dominant form of saving at the time, hence Regulation Q suppressed the return to saving. This drove up aggregate demand, which pushed up inflation and further lowered the real return to saving, setting off an inflation spiral. The repeal of Regulation Q broke the spiral by sending deposit rates sharply higher. We document that the rise and fall of the Great Inflation lines up closely with the imposition and repeal of Regulation Q and the enormous changes in deposit rates and quantities it produced. We further test this explanation in the cross section using detailed data on local deposit markets and inflation. By exploiting four different sources of geographic variation, we show that the degree to which Regulation Q was binding has a large impact on local inflation, consistent with the hypothesis that Regulation Q explains the observed variation in aggregate inflation. We conclude that in the presence of financial frictions the Fed may be unable to control inflation regardless of its policy rule.
I’m going to annoy almost everyone here, so let me apologize in advance. I realize that these authors are now in the mainstream and that I’m a hopeless dinosaur. It’s a perfectly fine paper by conventional standards. Nonetheless, I can’t get past the very first sentence of the abstract. Why do economists think it’s a good idea to propose a new explanation for the Great Inflation? Imagine a physics paper that began by noting that while Isaac Newton had already proposed a theory for why feathers and steel balls fall at the same rate in a vacuum tube, the authors were about to provide a “new explanation”. Why?
As I got into the paper, my frustration only increased. I expected them to push back on what I thought was the standard theory, the idea that the Great Inflation was caused by the Fed aggressively increasing the money supply. Instead, they suggest that the standard explanation is that the Fed failed to act aggressively to stop the Great Inflation, which presumably happened for some other unnamed reason:
The standard narrative of the Great Inflation places much of the blame on the Federal Reserve. By failing to act aggressively enough, the Fed had allowed inflation to get out of hand and squandered its credibility with the public (Clarida, Gali and Gertler, 1999). The loss of credibility raised inflation expectations, which made inflation accelerate further.
Now you might argue that an aggressive rise in interest rates would have reduced money growth, but that just annoys me in two other ways. First, it confuses cause and effect. Prior to 2008, the Fed raised interest rates by reducing money growth, not vice versa. Second, it ignores the income and Fisher effect, and more broadly the NeoFisherian perspective. The Great Inflation happened partly because the Fed had forgotten Humean economics, the idea that inflation is caused by printing too much money. Instead, the Fed wrongly thought that the high interest rates of the late 1960s and the 1970s were a tight money policy. It was not.
And it’s not just these three economists. A week ago I quoted Paul Krugman:
The truth is that I’ve always been a bit uneasy about the standard story of inflation in the 1970s, even though it seemed to fit the prediction of clockwise spirals. My uneasiness came from the sense that the economy never seemed to run hot enough to explain such a big rise in inflation. I actually remember the 70s! And while there were years of good job markets, they never felt as good as the 60s, the late 90s, or 2019.
Krugman’s “standard story” is not printing money, it’s not an unaggressive Fed, it’s not even Regulation Q. Rather Krugman suggests that the standard story of the Great Inflation is the Phillips curve model—high inflation is caused by low unemployment (a hot economy). But while the Phillips curve may have some limited ability to account for negative inflation/unemployment correlations at business cycle frequencies, it tells us precisely nothing about long run inflation dynamics (or, as Lucas (1975) showed, cross sectional differences in inflation.) And the Great Inflation was a long run phenomenon. There were four recessions between 1966 and 1982. The economy certainly ran “hot enough” in NGDP growth terms to fully explain the Great Inflation.
More broadly, the Great Inflation is clearly just an extreme event embedded within a much greater Great Inflation of 1933-2020, when the CPI rose 20-fold. I cannot emphasize enough that this was a monetary event. Unemployment wasn’t substantially different during the gold standard era than during modern times, indeed it was lower during 1923-29 (a period of roughly zero inflation) than during the 1970s, a period of high inflation. The price level is 20 times higher in 2020 than 1933 (after essentially no change in the previous 150 years) because we printed a lot of money, not because of anything to do with Phillips curves or Regulation Q.
3. Cognitive illusions, everywhere you look
Since the high inflation on the right side of the price level hockey stick was clearly due to monetary policy, why wouldn’t we have expected a sharp acceleration of money growth in the 1960s to lead to a sharp acceleration of inflation? Why did we forget the monetary theory of inflation and begin seeking other explanations?
I see three explanations, each of which plays a role:
1. Too much focus on Phillips curve models, which should not be used to explain persistent changes in inflation.
2. Too much focus on interest rates as an indicator of whether money is easy or tight. This makes it look like monetary policy doesn’t play much of a role, as high interest rates usually occur during periods of high inflation, and vice versa.
3. Incorrect predictions of inflation by monetarists and others when the Fed adopted quantitative easing, as pointed out by the authors of the Regulation Q study:
Scholars of the Great Inflation, such as Allan Meltzer (2009; 2013) and John Taylor (2009), worried that low interest rates and Quantitative Easing would lead to a repeat of the 1970s.
Lots of monetarists underestimated the impact of the 2008 decision to begin paying interest on bank reserves, which weakened the link between money growth and inflation. Hume’s amazing “out-of-sample” success that had lasted for 256 years came to an end in 2008.
I can’t really blame younger economists for finding the monetarist view of inflation to be hopelessly outdated. Even before 2008, the Fed was already targeting interest rates. Lots of economists don’t even know that (prior to 2008) the monetary base was 98% currency (the stuff in your wallet) and that the Fed moved interest rates by adjusting the quantity of base money, which as a practical matter meant adjusting the supply of currency.
Almost every aspect of our monetary system was designed to hide what’s actually happening. Even though the base was 98% currency in 2007, and even though almost all new base money quickly went out into circulation as currency, the new money did initially enter the system as electronic bank reserves. And even though the Fed controlled inflation by controlling the monetary base, they did so by moving the base to a position that moved interest rates to a position that was expected to lead to 2% inflation. In that regime, it’s easy to ignore money entirely, even though it was the money printing that was actually causing the inflation.
After 2008, it became even easier to ignore money. With the payment of interest on reserves the Fed no longer even had to adjust the monetary base in the background in order to move interest rates. Now they could simply adjust IOR to move rates directly.
Like journalists, economists are seduced by power. Once the powerful central bankers decided to focus on interest rates, macroeconomists decided that interest rates were the appropriate monetary variable for their models. The more “money-less” your model, the more sophisticated and up to date it seemed. What sounds more appealing to young economists, Michael Woodford’s futuristic vision of a cashless economy, or my reactionary obsession with the old days when the currency stock was more important?
Again, if you can show me that this post is wrong, and that the Great Inflation was not caused by printing money, then I’ll just give up. I’ll quit my job, I’ll stop blogging, and I’ll publicly apologize to all my former Bentley students, as it would mean that almost everything I taught them for 30 years was wrong. My entire view of macroeconomics is predicated on monetary policy driving nominal aggregates.
In my view, the “money printing caused the Great Inflation” hypothesis is not a theory in the sense that the man on the street uses the term theory (unproven hypothesis), it’s a theory in the sense that scientists use the term when discussing well established models like evolution.
READER COMMENTS
LEB
Feb 11 2021 at 11:21am
The Hume quote written in your own words is fascinating. Can you direct me to the original text as he wrote it?
christian zeller
Feb 11 2021 at 2:43pm
I think I read that in Hume’s essay “Of Money”.
Scott Sumner
Feb 11 2021 at 4:55pm
It’s not in one place, it’s scattered around his writings. When my book comes out later this year I’ll have a number of quotes from Hume that sort of put it all together. Sorry I can’t be more helpful now.
He did write on the links between money and prices, and also how changes in output and velocity could affect that correlation. So it’s sort of implied.
James
Feb 11 2021 at 8:11pm
Well, looking forward to your book then. I should have taken Hume more seriously in my philosophy school days. I might have gotten to a PhD that way.
LEB
Feb 12 2021 at 5:23pm
I am also looking forward to the book. I don’t always agree with all of your views, but you provide some really valuable insights in your posts here. One favorite was when you explained that the GDP equation is not a statement of causality, but an accounting equality. Thank you for sharing your thoughts and work.
David Henderson
Feb 11 2021 at 11:28am
Scott, Great post.
One error: you are not reactionary.
robc
Feb 11 2021 at 12:46pm
Scott isn’t, but I probably am. I agree with everything Scott wrote (although as a non-economist, that is worth nothing) AND want to return to the gold standard. That price level chart for the first 150 years looks good to me.
Brian
Feb 11 2021 at 3:44pm
You mean the good ol’ days when you only had 2 year expansions before the next recession.
Matthias
Feb 12 2021 at 8:56am
The frequent crises were mostly limited to the US.
Canada and Scotland had much better experience with the gold standard, thanks to much better regulation of finance. (Mostly, much less regulation.)
B King
Feb 12 2021 at 11:50am
I’m curious about this – I’ve never been able to get a gold standard person to explain to me how to get the kind of business cycle that seems possible under NGDP (re: minimal business cycle if any) when you can’t control your money supply.
Do you have any links to point me to so I can read up on this point of view?
Andrew_FL
Feb 13 2021 at 10:17am
@B King
That’s likely because most “gold standard people” are Rothbardians who favor vigilante mobs chasing bankers out of town, not supporters of free banking like Matthias.
Under a gold standard-free banking system it is the private banks which stabilize the effective money stream, not the Central Bank-which would not exist. And it is the broad money supply which they control, not base monetary gold.
If you want a scholarly exposition on how the private banking system would stabilize money payments, George Selgin has written some good papers.
Scott Sumner
Feb 11 2021 at 5:07pm
Thanks David. Yes, some people call me a Keynesian or even a socialist. So yes, reactionary is probably not the right term. It’s depends on who is judging me–where they are coming from.
John Hall
Feb 11 2021 at 12:20pm
Great post .
You write “With the payment of interest on reserves the Fed no longer even had to adjust the monetary base in the background in order to move interest rates. Now they could simply adjust IOR to move rates directly.” What does it take to have meaningful inflation in a regime that has interest rates on reserves? I don’t think I have the best grip on the theory there.
TMC
Feb 11 2021 at 12:32pm
Thanks. Most of economics is pretty intuitive for me, but monetary policy is not. Appreciate the clear explanations.
TMC
Feb 11 2021 at 12:35pm
Since we can mine bitcoin, and it seems to be considered a currency now, would digital currencies add to inflation?
Josh B
Feb 11 2021 at 4:41pm
Monetary velocity is also involved, and since each Bitcoin is much more likely to sit around in an account, or be traded, but not used to pay for goods and services, it isn’t likely to cause inflation.
Scott Sumner
Feb 11 2021 at 5:00pm
See my reply to Brian below. In theory, Bitcoin could affect velocity, but I expect the Fed to offset that.
Thomas Hutcheson
Feb 11 2021 at 12:56pm
It seems to me that which instruments the Fed uses to move macroeconomic outcomes or even what models it uses internally is not something that needs widespread discussion. It makes sense that economic and technological developments are constantly changing the parameters of the GE model the Fed needs to solve to keep employment at a maximum and the price level rising at an optimal rate. Consequently, outsiders generally needn’t try to second guess that model and then criticize the values it chooses for its instruments, but the outcomes it achieves or fails to achieve.
As a specialist activity, if we observe the Fed systematically failing as it has 2008-2021, we might try to find out if a) its model had the correct objective function and yielded mistaken values for the policy instruments, b) if the model misspecified the relations between policy instruments and outcomes, or c) if both the model and the objective function was correct but there are arbitrary constraints on some of the instruments, such as the size, rate of increase. or composition of the Fed balance sheet or that ST nominal rates must be > zero
Brian P. Moore
Feb 11 2021 at 1:04pm
For a non-economist like myself, what impact does this debate have on our current politics? Is our level of money printing currently too high, or too low? What policies over the past year have done one or the other, and what results (in price levels) should we expect that to cause over the next few years?
Scott Sumner
Feb 11 2021 at 4:59pm
I expect the Fed to adjust policy as needed to keep inflation in the 2% to 2.5% range over the next few years.
Matthias
Feb 12 2021 at 8:58am
Have a look at TIPS spreads to see what the market thinks inflation will look like in the next 5 or 10 years.
It’s pretty much on track at the moment.
Travis Allison
Feb 11 2021 at 1:15pm
We need to somehow bring about a blog debate between Paul Krugman and Scott. Maybe Tyler Cowen can arrange it?
Scott is probably the greatest macroeconomist in the US. At the same time, macroeconomics as practiced by the mainstream is going off the rails. It is no exaggeration to say that a debate between PK and Scott would open the eyes of economists everywhere and probably save the profession from the dark ages.
Scott Sumner
Feb 11 2021 at 5:01pm
Thanks, but I certainly don’t think I’ll be the one to save economics from the dark ages; it will be a younger and brighter economist.
Chris H
Feb 11 2021 at 1:29pm
E pur si muove!
Scott Sumner
Feb 11 2021 at 5:02pm
The money supply or interest rates? 🙂
AlexR
Feb 11 2021 at 1:37pm
Great post. My only quibble is with the characterization that macro risks falling into a Dark Ages in the 21st century. The sad fact is that macro was plunged into its current Dark Age nearly a century ago with the publication of Keynses’s Genenal Theory. It’s more a story of the persistence of muddled thinking rather than a forgetting, in my view. Despite brilliant work by Friedman and Schwartz and many others, monetarism has always been a minority view derided by the macro cognoscenti. No, Scott, don’t quit your day job!
NBK
Feb 11 2021 at 1:38pm
In the gravity example, is the emphasis on “Why?” As in you want people to state why they are proposing something new. Newton ended up being wrong about gravity so this example leaves me scratching my head.
Rhett
Feb 11 2021 at 1:38pm
Just a thought. Japan has taught us that a declining population is highly deflationary. Could it also be true that, in a modern economy, a baby boom is highly inflationary?
Scott Sumner
Feb 12 2021 at 1:07pm
I don’t think either is true. Plenty of babies born during the 1920s, but no inflation.
It’s monetary policy that determines inflation.
Andrew_FL
Feb 13 2021 at 10:26am
You’re right but the 20s aren’t a good example. Well, the early twenties are kind of a good example but the population growth rate dropped rapidly from about 2% from 1923 to 1924 to about 1% from 1928 to 1929. In fact, the period from 1930 to ca 1950, the theory “population growth causes inflation” looks pretty good, although it’s really reverse causality.
Scott Sumner
Feb 14 2021 at 1:29pm
Also worth noting that population growth plunged during the 1970s.
MarkW
Feb 11 2021 at 1:41pm
The British Navy once forgot the cure for scurvy — why shouldn’t we see the same kind of thing in economics (especially when the old knowledge becomes politically inconvenient)? Maybe it’s just as true to say (sometimes anyway) that ‘science decays one funeral at a time’. How handy would a living, breathing, tweeting Milton Friedman be right about now?
Scott Sumner
Feb 11 2021 at 5:04pm
There’s something wrong with a field that gets worse with each funeral.
Njnnja
Feb 11 2021 at 2:41pm
The physics analogy that I think of when I see an abstract like that is that it feels like someone is reinventing epicycles after the Kepler model. Parsimony used to be important but now it seems that complexity is valued for its own sake.
Scott Sumner
Feb 11 2021 at 5:04pm
Good analogy.
Abel
Feb 11 2021 at 5:46pm
“Why do economists think it’s a good idea to propose a new explanation for the Great Inflation? Imagine a physics paper that began by noting that while Isaac Newton had already proposed a theory for why feathers and steel balls fall at the same rate in a vacuum tube, the authors were about to provide a “new explanation”. Why?”
The reason why is because the new theory might explain more phenomena. To take your example of Newton further, Einstein proposed a new theory that explained how steel balls and feathers fall in a vacuum plus explanations for what would happen to them as they approached the speed of light. And later, it explained what happened to space-time as its gravity increased. And it provided a lot of the tech we have now. Newton’s Theory of Gravity would not get us cell phones or lasers or nuclear energy, etc.
robc
Feb 12 2021 at 9:45am
Yes, but Einstein’s equations reduce to Newton’s at low speeds, they don’t replace them. Einstein added detail, he didnt replace.
That isn’t what is happening in macro, at least as I understand it.
Scott Sumner
Feb 12 2021 at 1:08pm
Of course the Regulation Q theory in the paper I discussed explains fewer examples, not more.
Spencer B Hall
Feb 12 2021 at 3:46pm
re: “Of course the Regulation Q theory in the paper I discussed explains fewer examples, not more.”
Hardly. It explains even more. Banks don’t loan out deposits. So an increase in Reg. Q ceilings would destroy money velocity (but other things weren’t equal). Bank debits to deposit accounts accelerated due to the “monetization” of time deposits or the monetary offset. Otherwise, like after 1981, velocity would have fallen.
Further evidence is the rise in FDIC deposit insurance. Further evidence is the remuneration of IBDDs which destroyed the nonbanks. Further evidence is Dr. Philip George’s corrected money supply.
Case closed.
Garrett
Feb 11 2021 at 3:54pm
I’m not an economist, but as one of your former students, the stuff you taught me enormously helped me to make sense of the last decade.
Scott Sumner
Feb 11 2021 at 5:05pm
Thanks Garrett, I really appreciate that. You were one of my best students.
Mario J Rizzo
Feb 11 2021 at 5:19pm
I am not saying anything you don’t really know. But the reason Drechsler, Savov, and Schnabl need to propose a new explanation is because that how you make a name for yourself in an over-crowded profession. I think we economists should pay more attention to the incentive structure of the discipline.
Scott Sumner
Feb 12 2021 at 1:09pm
Good point.
Laron
Feb 11 2021 at 6:46pm
It’s interesting to read this right after reviewing various scenarios for our bank’s stress testing this year, which are being provided by a prominent rating agency/economic forecasting firm. They include a stagflation scenario in which inflation runs high as consumers spend stimulus dollars but supply chain issues constrain the supply of goods and oil. The Fed overreacts to this supply-side inflation by increasing the FF rate, which keeps unemployment high/productivity low.
I looked at it and thought of monetary offset and IOER, but was the only person that thought the scenario was in the lower end of future probabilities.
marcus nunes
Feb 11 2021 at 7:11pm
Maybe the fact is that monetary policy is “too simple” a subject to be taken seriously!
Two posts that deal with that:
https://marcusnunes.substack.com/p/sometimes-monetary-policy-gets-it
https://marcusnunes.substack.com/p/powell-had-his-eureka-moment-monetary
Ahmed Fares
Feb 11 2021 at 7:36pm
Inflation causes money printing and not the other way around.
Yes, that is true; Henwood adopts the Monetarist explanation that “too much money” causes inflation. He confuses causation and correlation. Severe supply constraints can push up prices, increasing the amount of money that needs to be created both publicly and privately to finance purchases. Tax revenues fall behind spending so a deficit opens up as spending tries to keep pace with inflation. The money stock is a residual and it will grow rapidly with hyperinflation. That does not mean it is the cause. Mitchell has closely examined the hyperinflation cases from the MMT perspective; the argument is not at all odd and has the advantage that it is fact-based, unlike Henwood’s Monetarist linking of money and inflation that has been so thoroughly discredited that even central bankers have dropped it. —L. Randall Wray
j r
Feb 11 2021 at 10:23pm
“Inflation causes money printing and not the other way around.”
I am having a hard time discerning the meaningful difference between these two models. They seem to be describing the same process, but from different points in the cycle.
A supply shock leads to higher inflation (too many dollars chasing too few goods and services), which leads to a widening of the fiscal deficit (lower tax revenue from less economic activity, plus higher social transfers), which leads to the printing of more money (to help finance the deficit), which leads to a supply shock (more nominal dollars chasing fewer real goods and services), which leads to higher inflation, which….
My takeaway from this is that good monetary policy can support a healthy economy (1) through a steady increase in the supply of money in line with the real economy’s need for money and (2) by helping to smooth certain kinds of shocks. But the idea that you can actively manage the economy through monetary policy, either through managing Philips Curves tradeoffs or by handing over monetary policy to the fiscal authorities, is a pipe dream. Real economic growth is the ability to create more goods and services with fewer inputs. Good monetary policy can support real growth, but it can’t solve the non-monetary structural problems that stand in the way of real growth.
Scott Sumner
Feb 12 2021 at 1:12pm
History is littered with lots of natural experiments showing that exogenous increases in M cause inflation.
Jean Passepartout
Feb 11 2021 at 7:51pm
What religious dogma explains this motivated indifference to evidence? I suggest it is the utter refusal to admit that in the short run resources and capital are constrained and even apart from that printing and giving away money can’t solve many problems anyway. The idea that people have to earn a good life by increasing their human capital and productivity is anathema to the left.
Alex Armlovich
Feb 11 2021 at 8:25pm
Hi Scott,
Longtime reader here. I wanted to note that the Regulation Q paper appears broadly consistent with your views based on that quick summary?
Hitting the Reg Q interest ceiling on nominal rates paid to interest-bearing deposits made those deposits more “money-like” and less “bond-like” by depressing the real rate of interest paid on them. Just as you understand that paying interest on excess reserves created a large shock to the velocity of base money, hitting the Reg Q cap should have been a shock to increase the velocity of interest-bearing deposits closer to cash–the hot potato getting hotter. That velocity shock would’ve been an accelerant on top of the rapid rate of change in quantity of money consistent with your point on the paying of interest affecting velocity.
Scott Sumner
Feb 12 2021 at 1:14pm
The Fed would have offset that effect if it wanted to. So I don’t agree.
In any case, you can’t explain the Great Inflation by pointing to the money multiplier, or shifts in money demand. They simply printed too much money.
Alex Armlovich
Feb 15 2021 at 6:40pm
Agreed with you on the primary channel! Just seems like they’ve identified a usefully complementary explanation of a velocity shock on top of quantity growth when Reg Q is binding.
Ted Durant
Feb 11 2021 at 9:39pm
That graph would be more useful with a log-scaled vertical axis.
Scott Sumner
Feb 12 2021 at 1:14pm
I agree.
Kaleberg
Feb 11 2021 at 11:06pm
I think you lost me with the “printing too much money” thing. The reason they were printing so much money was that the working population was growing and living standards were rising. If you the theory of supply and demand, you would expect prices to rise when the economy is growing.
Labor had the political and economic power to increase wages to match rising prices, so if you worked for a living, inflation might be a short term problem, but not a a mid or long term problem. More goods and more people required more money. If the government didn’t print it, people would have worked out a way to fake it.
Through the 1970s, there was a successful campaign to stop the rise in living standards and eliminate labor power. Living standards have stagnated or declined. The value of labor has been repeatedly ratcheted downward. We still have inflation, but it is primarily in the prices of things that only those in the top 1% or less tend to buy in bulk.
I lived through that period, and it was rather obvious what was going on. When the head of the Federal Reserve uses the elimination of union wage scales as his inflation fighting benchmark, it becomes hard to believe that it was all about printing money. It was all about lowering living standards. The quantity of money was just a metric.
Most people barely believe that the post-war prosperity even existed, and they forgot how it was made and how it worked. If there is any forgetting, that’s where it can be found.
Mark Bahner
Feb 12 2021 at 12:14am
Suppose an economy is entirely composed of two people, with 10 one-dollar bills, and 10 apples. Then the economy still has 10 one-dollar bills, but 20 apples, and the price of apples goes up? How would that be, if there is the same amount of money, but twice as many apples?
I think you’re confusing a price increase in a relatively small group of goods with “inflation.”
Matthias
Feb 12 2021 at 9:02am
During the so called Long Depression, the price level fell as living standards rose and populations and productivity grew.
Scott Sumner
Feb 12 2021 at 1:16pm
You said:
“If you the theory of supply and demand, you would expect prices to rise when the economy is growing.”
Just the opposite. The theory of S&D suggests that a growing economy should increase the demand for money, which is deflationary. That’s why we had deflation in the late 1800s, and in the 1920s, the economy grew fast.
In any case, growth was not above normal during 1966-81, no better than in 1950-66.
Mark Bahner
Feb 12 2021 at 12:39am
The most famous environmental “hockey stick,” by far, is the graph of historical global surface temperatures first proposed by Michael Mann et al.:
Hockey stick graph
P.S. Global carbon dioxide emissions aren’t increasing at anything like the blade of a hockey stick coming up from the shaft:
Global carbon dioxide emissions
Scott Sumner
Feb 12 2021 at 1:17pm
Use a longer time scale for carbon and you get a hockey stick.
Mark Bahner
Feb 12 2021 at 6:17pm
Yes, use a longer time scale for virtually any aspect of human activity, and you get a hockey stick, e.g.:
production of steel, aluminum, paper, plastic, wheat, rice, corn, etc.
human life expectancy at birth
GDP and GDP/capita
population
average speed of transportation
carbon dioxide emissions, sulfur dioxide emissions, nitrogen oxide emissions, etc.
etc. etc. (etc.)
So it’s basically meaningless to say, for carbon dioxide emissions, “use a longer time scale and you get a hockey stick”.
As I noted, to someone knowledgeable about environmental matters, especially with respect to climate change, the “hockey stick graph” refers to the historical global temperature analysis by Mann et al. That’s why there’s a Wikipedia entry for “hockey stick graph” that discusses the Mann et al. analysis, and not historical carbon dioxide emissions.
Scott Sumner
Feb 13 2021 at 2:11pm
I think you are confused on this issue. Almost all these hockey stick graphs (except perhaps computers) use long time scales. That includes global temperatures.
Mark Bahner
Feb 17 2021 at 1:32pm
No, Scott, I am not “confused on this issue.” You are ignorant on this issue. And even though I gave you the chance to educate yourself, you appear not to have taken it.
You wrote, about “hockey stick” graphs:
I have an advanced degree in environmental engineering and approximately 30 years of experience in environmental analyses, mostly related to air pollution (and often related to climate change). If you say “hockey stick graph” to environmentalists, they do not think of “carbon emissions.” They think of the analyses of global surface temperature performed by Michael Mann et al…just as in the Wikipedia article to which I previously linked.
Do a simple Google search for the phrase “hockey stick graph.” Report what you find. You should be able to see (and then admit) your error.
P.S. If I seem ticked off, it’s because there seems to be a complete inability by most people to admit simple and obvious errors. I spent many hours trying to get Dr. Steven Novella to correct this simple and obvious error:
No, it did not take two days to “develop” Moderna’s vaccine
He never did simply admit that he should have used the word “design” or “formulate,” rather than “develop.”
Eric
Feb 12 2021 at 12:58am
I enjoyed this article a lot, probably because it reinforces my similar beliefs. I finished grad school in the early 1990s and this was the dominant explanation at that time and still makes good sense. The current research doesn’t pass the “intuition” test. Could massive money printing really have no relationship to inflation? If you think of it on a very small scale such as a neighborhood or even a household, if they mostly traded within their group an increase in the money supply would definitely cause inflation as they bid up items with more scarcity.
Lliam Munro
Feb 12 2021 at 4:12am
Thanks for posting this. It was well timed for me personally as I’d just read this post from a well-known New Zealand property investor:
https://nopunchespulled.com/2021/02/05/inflation/
New Zealand is currently spending up large and printing money. I have been anticipating that this would lead to inflation and so read his post with some interest. Having read it, I had been reflecting to myself that if, controlling for GDP, printing extra money did not cause the unit of currency to depreciate then I really didn’t understand anything about how the economy worked.
Scott Sumner
Feb 14 2021 at 1:31pm
Printing money is only inflationary during periods when the demand for money is not rising. At zero interest rates, lots of money can be printed without creating inflation.
Rajat
Feb 12 2021 at 7:42am
A sad and sorry tale. I recall you saying that IOER was introduced around the time of the Lehman failure to ‘sterilise’ the bailout. Do we know whose idea it was? Was it driven by Fed boffins or Bernanke?
BTW, I just received my copy of Ed Nelson’s two volume Milton Friedman biography (Amazon works 50 times slower to Australia). Have you taken a look at it?
Matthias
Feb 12 2021 at 9:03am
George Selgin wrote a lot on ioer. Look up his work.
Scott Sumner
Feb 12 2021 at 1:18pm
I plan to read it this spring.
Todd Ramsey
Feb 12 2021 at 9:21am
Scott, I have quibbled with your posts a lot lately. So this seems like a good time to point out that every time I DON’T post a disagreement, I wholeheartedly agree with the logic of your post.
I’m a huge fan, grateful for your efforts moving the Fed to where it acted massively in March 2020, preventing millions of job losses. Thank you!
Scott Sumner
Feb 12 2021 at 1:19pm
Thanks Todd.
Mike Davis
Feb 12 2021 at 2:20pm
I saw Phillip Schnabl present their paper in a seminar a couple of weeks ago and, despite it being a good presentation, I was left with many questions. One can (and should!) quibble with their empirics but I as far as I can see the whole story doesn’t add up.
They start by claiming that Reg Q become binding around 1965. Maybe yes, maybe no. There are lots of ways willing buyers and sellers can evade price controls, but let’s just say they’re right.
This, they claim, discouraged private saving and led to a binge of household consumption. Again, maybe yes, maybe no. Households might have reacted by finding different channels for saving (small real estate investments, breeding chinchillas, whatever) or they might have elected to work less. But again, let’s give them this one too.
In the Schnable et al story, then, this glut of consumption spending pushed up aggregate demand, leading to the Great Inflation. When Reg Q became less of a binding constraint in the mid 1970’s, households had a reason to save again. Once that happened aggregate demand was no longer being driven by a frenzy of household consumption and inflation subsided.
If I’ve got their story right, it seems quite clear that Schnable et al are committing the Scrooge McDuck Fallacy. Savings don’t just sit in some counting house on McDuck’s estate. Savings are put back into the investment stream. If Reg Q reduces the level of household saving, consumption will go up but investment will go down. If Reg Q goes away, consumption will fall only if the households can earn a greater return on savings–and that can only happen if those savings are invested. In other words, I think it most likely that Reg Q altered the composition of aggregate demand, but not the overall level.
With that said, if we’re spinning theories over cocktails, I think there might be two stories that could (but probably don’t!) link Reg Q with the Great Inflation.
First story: Reg Q, like many inefficient regulations promoted by the crony capitalists, reduced aggregate supply. But of course—and let’s pause here while Scott cleans up the beer bottle he’s just thrown across the room in anger—an inflation caused by a negative supply shock can’t happen unless the monetary authorities fail to recognize and adjust to the supply shock. Inflation is still a monetary phenomenon. (On a similar note, btw, if we see inflation happening in the next couple of years, how many people are going to say that it’s a consequence of Covid and not a feckless Fed?)
Second story: Scrooge McDuck lives! Through some horrible defect in our financial plumbing, household saving doesn’t get channeled into investment spending. As a consequence, fluctuations in household savings driven by the vagaries of regulation might impact aggregate demand. ( But isn’t this just a way of saying that financial regulation can effect velocity. That makes the Fed’s job harder but doesn’t mean that controlling inflation isn’t their job.)
Scott Sumner
Feb 12 2021 at 3:45pm
Good comment. A couple points:
1. The Great Inflation was not due to a supply shock, as RGDP grew at a solid pace during 1966-81; it was fast AD growth (NGDP) that caused the Great Inflation.
2. You comment suggests they used a Keynesian model where things like consumer sentiment affect demand. In my view the Keynesian model is wrong; monetary policy determines aggregate demand. I didn’t criticize them on that specific point because they were within the Keynesian tradition, but I reject that entire approach.
If the Fed didn’t want inflation they would have tightened policy to prevent it. But they did not. I lived through the period and recall the latter portion quite well. The mistakes were OBVIOUS, even at the time.
Spencer B Hall
Feb 12 2021 at 3:15pm
“the Great Inflation of 1966-81 was caused by central banks printing too much money”
Stagflation was the result of the transition from clerical processing to electronic process, and the end of gate keeping restrictions on time deposits. All of which is documented by the G.6 Debit and Demand Deposit Turnover release.
Princeton Professor Dr. Lester V. Chandler (Ph.D., Economics Yale) 1961 theoretical explanation was:
“that monetary policy has as an objective a certain level of spending for N-gDp and that a growth in interest-bearing deposits in the payment’s system involves a decrease in the demand for money balances, and that this shift will be reflected in an offsetting increase in the velocity of the remaining transaction’s deposits”.
The saturation of DD Vt according to Professor Dr. Marshall D. Ketchum, Ph.D. Chicago, Economics:
“It seems to be quite obvious that over time the “demand for money” cannot continue to shift to the left as people buildup their savings deposits; if it did, the time would come when there would be no demand for money at all”.
Thus, and therefore money velocity, the S-Curve” hybrid dynamic damage (sigmoid function) plateaued by the first half of 1981 (with the end of gated deposits, the widespread introduction of ATS, NOW, SuperNow, and MMDA accounts).
That is, as stagnant (or frozen) time deposits became unhinged (the deregulation of Reg. Q ceilings), the velocity in the residual deposits were to be an offset in AD. The increased “demand for money” would thus be compensated in the turnover of the ungated transactions’ deposits.
Spencer B Hall
Feb 12 2021 at 4:46pm
re: “Ended by Paul Volcker who restored Fed credibility”
LOL. The DIDMCA of March 31st 1980 destroyed money velocity. It deregulated interest rates and turned 38,000 nonbanks into 38,000 banks.
Spencer B Hall
Feb 12 2021 at 4:54pm
re: “- low real deposit rate → deposit outflows → banks lose funding
(“disintermediation”) → credit crunch → firms constrained →
output falls, unemployment rises”
LOL. All monetary savings originate within the payment’s system. As time deposits grow, demand deposits are depleted $ for $.
Spencer B Hall
Feb 12 2021 at 4:56pm
The banks have not suffered disintermediation since 1933 (with the small exception in 2008).
WSJ: “In a letter of March 15, 1981, Willis Alexander of the American Bankers Association claims that: ‘Depository Institutions have lost an estimated $100b in potential consumer deposits alone to the unregulated money market mutual funds.’ As any unbiased banker should know, all the money taken in by the money funds goes right back into the banks, in the form of CDs or bankers acceptances or other money market instruments; there is no net loss of deposits to the banking system. Complete deregulation of interest rates would simply allow a further escalation of rates by the banks, all of which compete against each other for the same total of deposits.”
Written by Louis Stone whom the movie “Wall Street” was dedicated to – Vice President Shearson/American Express
Spencer B Hall
Feb 13 2021 at 9:18am
Yes. The Federal Reserve, under Chairman William McChesney Martin Jr., re-established stair-step case functioning (and cascading), interest rate pegs in c. 1965 (like during WWII), thereby using a price mechanism (like President Gerald Ford’s: “Whip Inflation Now”), and abandoning the FOMC’s net free, or net borrowed, reserve targeting position approach (quasi-monetarism), in favor of the Federal Funds “bracket racket” in 1965 (presumably acting in accordance with the last directive of the FOMC, which set a range of rates as guides for open market policy actions).
Using interest rate manipulation as the monetary transmission mechanism is non sequitur.
Spencer B Hall
Feb 14 2021 at 8:33am
Sumner’s never read: MR. GARVY’S “Deposit Velocity and its Significance”
Spencer B Hall
Feb 14 2021 at 8:36am
re: “A large exogenous increase in the money supply will cause a roughly proportional increase in NGDP.”
That’s obviously not true. Velocity has steadily fallen since 1981. It accelerated its decline with the payment of interest on interbank demand deposits and the FDIC’s increase in deposit insurance from $100,000 to $250,000.
Roger D Barris
Feb 14 2021 at 1:02pm
Hi Scott:
Do you have a single article that discusses both the post-2008 world and why the Fed’s actions did not create inflation (mostly relating, I imagine, to IOR) AND also what has been happening in Japan? These strike me as the two potential counterfactuals to your claims here. Alternatively, can you point me to multiple articles where you discuss these?
Roger
BTW. I read and greatly enjoyed “The Midas Paradox” on the suggestion of Alex Tabarrok. (It wasn’t easy to find.)
Scott Sumner
Feb 14 2021 at 1:33pm
My new book will explain both of those issues; it comes out later this year.
Thanks for reading the Midas Paradox.
Manfred
Feb 14 2021 at 6:59pm
Scott,
Incredibly illuminating post. As most of yours.
Two questions – if I may:
a) where does Milton Friedman fit in, in the whole story? You do not mention him, and I was wondering why.
b) the second question is related to the story after 2008: you say that the interest payments on reserves played a big role (or so I understood, please set me straight). It played a big role in holding down inflation, apparently. Is there a paper or blog entry or something that studies this more carefully?
thanks
Pietro
Feb 16 2021 at 6:48pm
I’ve prebought your next book on Amazon. I’m about half way through Midas Paradox and Macro Principles. Please don’t give up 🙂
Comments are closed.