In a 2022 blog post at the St Louis Fed, Kevin Kliesen looked at the impact of seven policy tightening episodes since the early 1980s:
As shown in the table below, the March action marks the start of the seventh tightening episode since the 1981-82 recession, which began a period often termed the Great Moderation. For purposes of this blog post, a tightening episode is an initial increase in the FFTR followed by a series of subsequent increases.
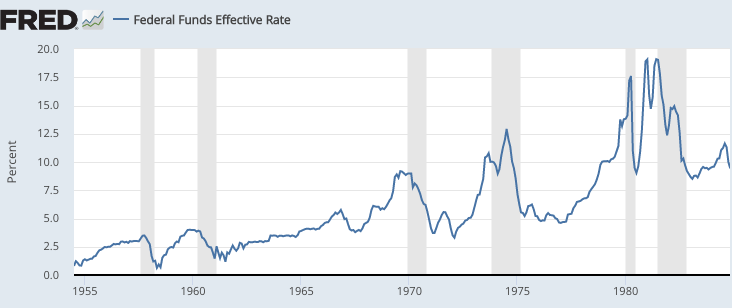
Readers of this blog know that I don’t regard rising interest rates as a sign of policy tightening. To see why, take a look at interest rates in the period before 1980:

Interest rates bottomed out in 1961, and then rose throughout most of the 1960s (with the exception of 1967). Does it make sense to regard the 1960s as policy tightening? The money supply rose very rapidly throughout the 1960s. Inflation rose from just over 1% to about 6%. NGDP growth was very rapid. In my view, it makes more sense to view rising interest rates as a consequence of fast NGDP growth, which was created by an expansionary monetary policy.
You might wonder what difference it makes whether we call rising rates a policy tightening, or some other term. The problem isn’t the terminology, it’s the inferences we make if we misidentify the stance of monetary policy. In my previous post, I discussed how some people assume monetary policy was not very effective, because they wrongly assume that fast rising interest rates reflect tight money.
Kliesen has a follow up post where he looks at the consequences of money tightening. Here’s one example:
The third figure shows the civilian unemployment rate. Similar to the previous two figures, the unemployment rate was falling prior to liftoff, which is indicative of a strengthening economy. The unemployment rate continued to decline, on average, until about six quarters after liftoff, then stabilized thereafter. Two years after liftoff, the unemployment rate across the six episodes of Fed tightening averaged 5.2%, about 1 percentage point less than its average during those episodes’ liftoff quarter.
He is referring to this graph:
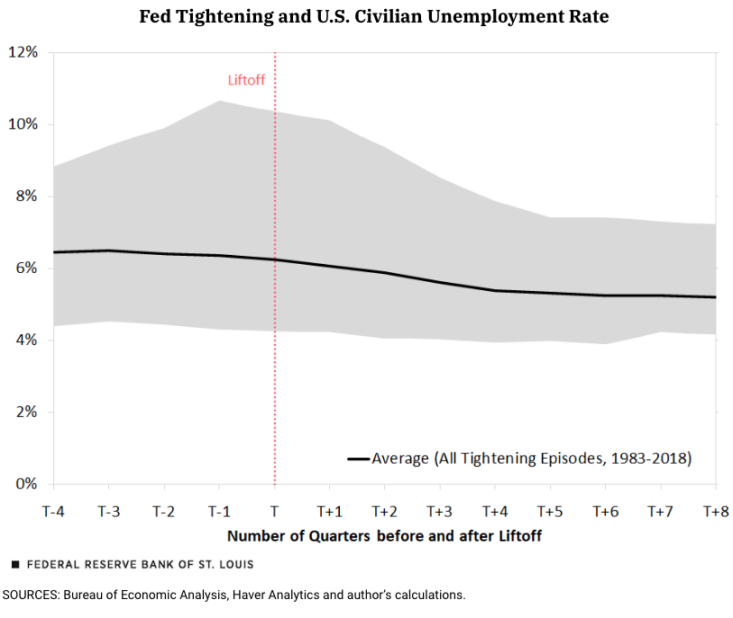
Does that look like a graph showing the impact of tightening monetary policy? Or does that look like the graph of the effect of expansionary monetary policy that leads to robust NGDP growth and higher interest rates? Based on the pattern of interest rates during the 1960s, is it any surprise that unemployment declines for years after rates start rising? (Unemployment fell throughout the 1960s.)
Another example is the late 1970s. Rates began rising in 1977. For several years, inflation continued to accelerate and unemployment declined. Then Paul Volcker was appointed Fed chair in late 1979 and raised rates very sharply, to levels above the natural rate of interest. The economy quickly fell into recession. An actual tight money policy doesn’t take years to affect the unemployment rate. More likely, the period from 1977 to 1979 was not policy tightening—despite rising interest rates. Instead, it reflected the income and Fisher effects, the fact that a booming economy with high inflation will raise the equilibrium rate of interest.
So it does matter how we label the stance of monetary policy. If we wrongly see rising interest rates as tight money, we will fail to accurately predict the impact of an actual monetary tightening on the economy. In the worst cases it leads to policy fatalism—an assumption that monetary policy is ineffective. That leads policymakers to seek much less effective remedies, such as fiscal policy or (even worse) price controls.
READER COMMENTS
spencer
Dec 11 2023 at 10:48am
The 60’s were marked by the banks wanting to get a bigger piece of the loan pie. They were jealous of the thrift’s rapid growth since WWII. Their competitive efforts were reflected by the lobbying of legislators to raise Reg. Q ceilings, as the thrifts weren’t so regulated until the first credit crunch in 1966.
It was then that Chairman William McChesney Martin Jr., re-established WWII interest rate pegs. Buy operations were performed when effective federal funds rate hit the top of the bracket. And with the banks uniformly agitating for greater growth, all the activity was on the top of the range during the late 60’s. That is, the bankers actually usurped the FED’s open market power. It was no happenstance that policy rates rose.
spencer
Dec 12 2023 at 8:45am
re: “the impact of seven policy tightening episodes since the early 1980s”
Contrary to the pundits, banks don’t lend deposits. As Dr. Leland J. Pritchard, Ph.D. Economics, Chicago 1933, M.S. Statistics, Syracuse, posited after the passage of the Depository Institutions Deregulation and Monetary Control Act:
“The DIDMCA will have a pronounced effect in reducing money velocity”. Everybody else was clueless.
And the 60’s “Great Inflation” was due to the monetization of time deposits, the relaxation of gate keeping restrictions and bank regulation on deposits.
Comments are closed.